Build and Backtest Trading Strategies Without Code: From Plain English Rules to Validated Results
Build and Backtest Trading Strategies Without Code: From Plain English Rules to Validated Results
Most traders are not programmers, but that should not stop them from testing strategies with real data. This guide walks through how to build a trading strategy in plain English, run it across years of market data on TradeZella, read the results, and move from backtest to live trading with confidence.
class SampleComponent extends React.Component {
  // using the experimental public class field syntax below. We can also attach
  // the contextType to the current class
  static contextType = ColorContext;
  render() {
    return <Button color={this.color} />
  }
}
Last Updated: July 16, 2026
Building and backtesting a trading strategy used to require programming skills. You needed Pine Script, Python, or another language just to test whether a simple EMA crossover worked. That barrier kept most retail traders stuck with gut feelings, small sample sizes, or untested ideas. TradeZella's automated backtesting removes that barrier entirely. You describe your strategy in plain English, the platform translates it into executable logic, and it runs across years of market data in seconds. No code. No scripting. No technical prerequisites. This guide walks through the entire process, from writing your first rule to moving a validated strategy into live trading.
Why No-Code Backtesting Changes Everything
Most traders are not programmers. They understand setups, risk management, and market structure, but they have never written a line of Pine Script. Before no-code platforms, those traders had two options: learn to code (weeks to months of effort that does nothing for their actual trading) or skip backtesting entirely and trade untested ideas with real money.
Neither option makes sense. A trader who can describe "buy when price breaks above the opening range high with volume confirmation, stop below the range low, target 2R" has a testable strategy. The only thing standing between that description and a 500-trade backtest used to be programming ability. Now it is a text box.
Plain English backtesting does not simplify the analysis. It simplifies the input. You still get the same rigorous output: every individual trade visible, full metrics, equity curves, and monthly breakdowns. You just skip the step where you learn a programming language to get there.
How to Describe Your Strategy in Plain English
The process starts with a description of what you trade. Write it the way you would explain your strategy to another trader. Be specific about five things:
Entry conditions. What needs to happen for you to enter a trade? Example: "Buy when the 9 EMA crosses above the 21 EMA on the 15-minute chart."
Exit conditions. How do you get out? Example: "Exit when price closes below the 9 EMA, or at a 2R profit target."
Direction. Long only, short only, or both.
Stop loss. Where does it go? Example: "Stop at the most recent swing low."
Filters. Any conditions that must be true before you look for entries. Example: "Only trade during regular trading hours. Only trade when the 200 EMA is trending up."
TradeZella Automated Backtesting
You do not need perfect syntax. The platform reads your description, identifies the components, and asks follow-up questions if anything is unclear. If you write "I trade breakouts above resistance with a stop below the level and a 2:1 target," the system will ask what defines resistance, which timeframe, and which instruments. You answer those questions, and the backtest runs.
After you write your description, the Enhance button uses AI to refine your rules. It identifies ambiguities, suggests missing filters, and tightens vague conditions into testable logic. Think of it as a second set of eyes on your strategy definition before you commit to the test.
Pre-Built Templates: Start Testing in Seconds
If you do not have a strategy written out yet, or if you want to test a popular approach quickly, pre-built templates let you skip the description step entirely. Select a template, choose your instrument and time period, and run the backtest.
Available templates include:
ICT setups: Fair Value Gap (FVG) with Change of Character (CHoCH) and Smart Money Technique (SMT), Asian range manipulation, Inverse FVG (iFVG), Break and Retest
Opening Range Breakout: First 15-minute or 30-minute range, breakout entries with range-based stops
Trend following: Moving average crossovers, higher-timeframe trend filters
Mean reversion: RSI extremes, Bollinger Band bounces, VWAP reversion
Templates are starting points, not finished strategies. Once a template runs, you can modify any parameter: adjust the timeframe, change the stop method, add session filters, tighten the entry conditions. This lets you iterate quickly. Run the template, review results, adjust one variable, run again. Each iteration takes minutes, not days.
All templates work across asset classes. You can test an ICT setup on ES futures, apply a mean reversion template to EUR/USD, or run an opening range breakout on AAPL. For asset-specific guidance, see backtesting stocks and forex backtesting. Prop firm traders can test templates under evaluation constraints before paying for a challenge.
Setting Your Controls
After you define the strategy (or pick a template), you set the parameters that shape the test:
Symbol: Which instrument to test. ES, NQ, EUR/USD, AAPL, BTC, or any supported asset.
Session: Regular trading hours, extended hours, or specific windows like the London session or New York open.
Time period: How far back to test. Years of historical data are available.
Trading days: All weekdays, or specific days only.
Risk per trade: Dollar amount or percentage of account.
Stop loss: Fixed, ATR-based, structure-based, or defined in your strategy rules.
Profit taking: Fixed R-multiple target, trailing stop, or condition-based exit.
If you skip any of these, the platform asks follow-up questions. It will not run a backtest with missing parameters. This prevents the common mistake of testing a strategy without defining risk, which produces misleading results.
On a $50,000 account risking $500 per trade (one percent), your controls might look like: ES futures, regular trading hours only, January 2023 through June 2026, all weekdays, $500 risk, stop at most recent swing low, target at 2R.
Reading Your Results
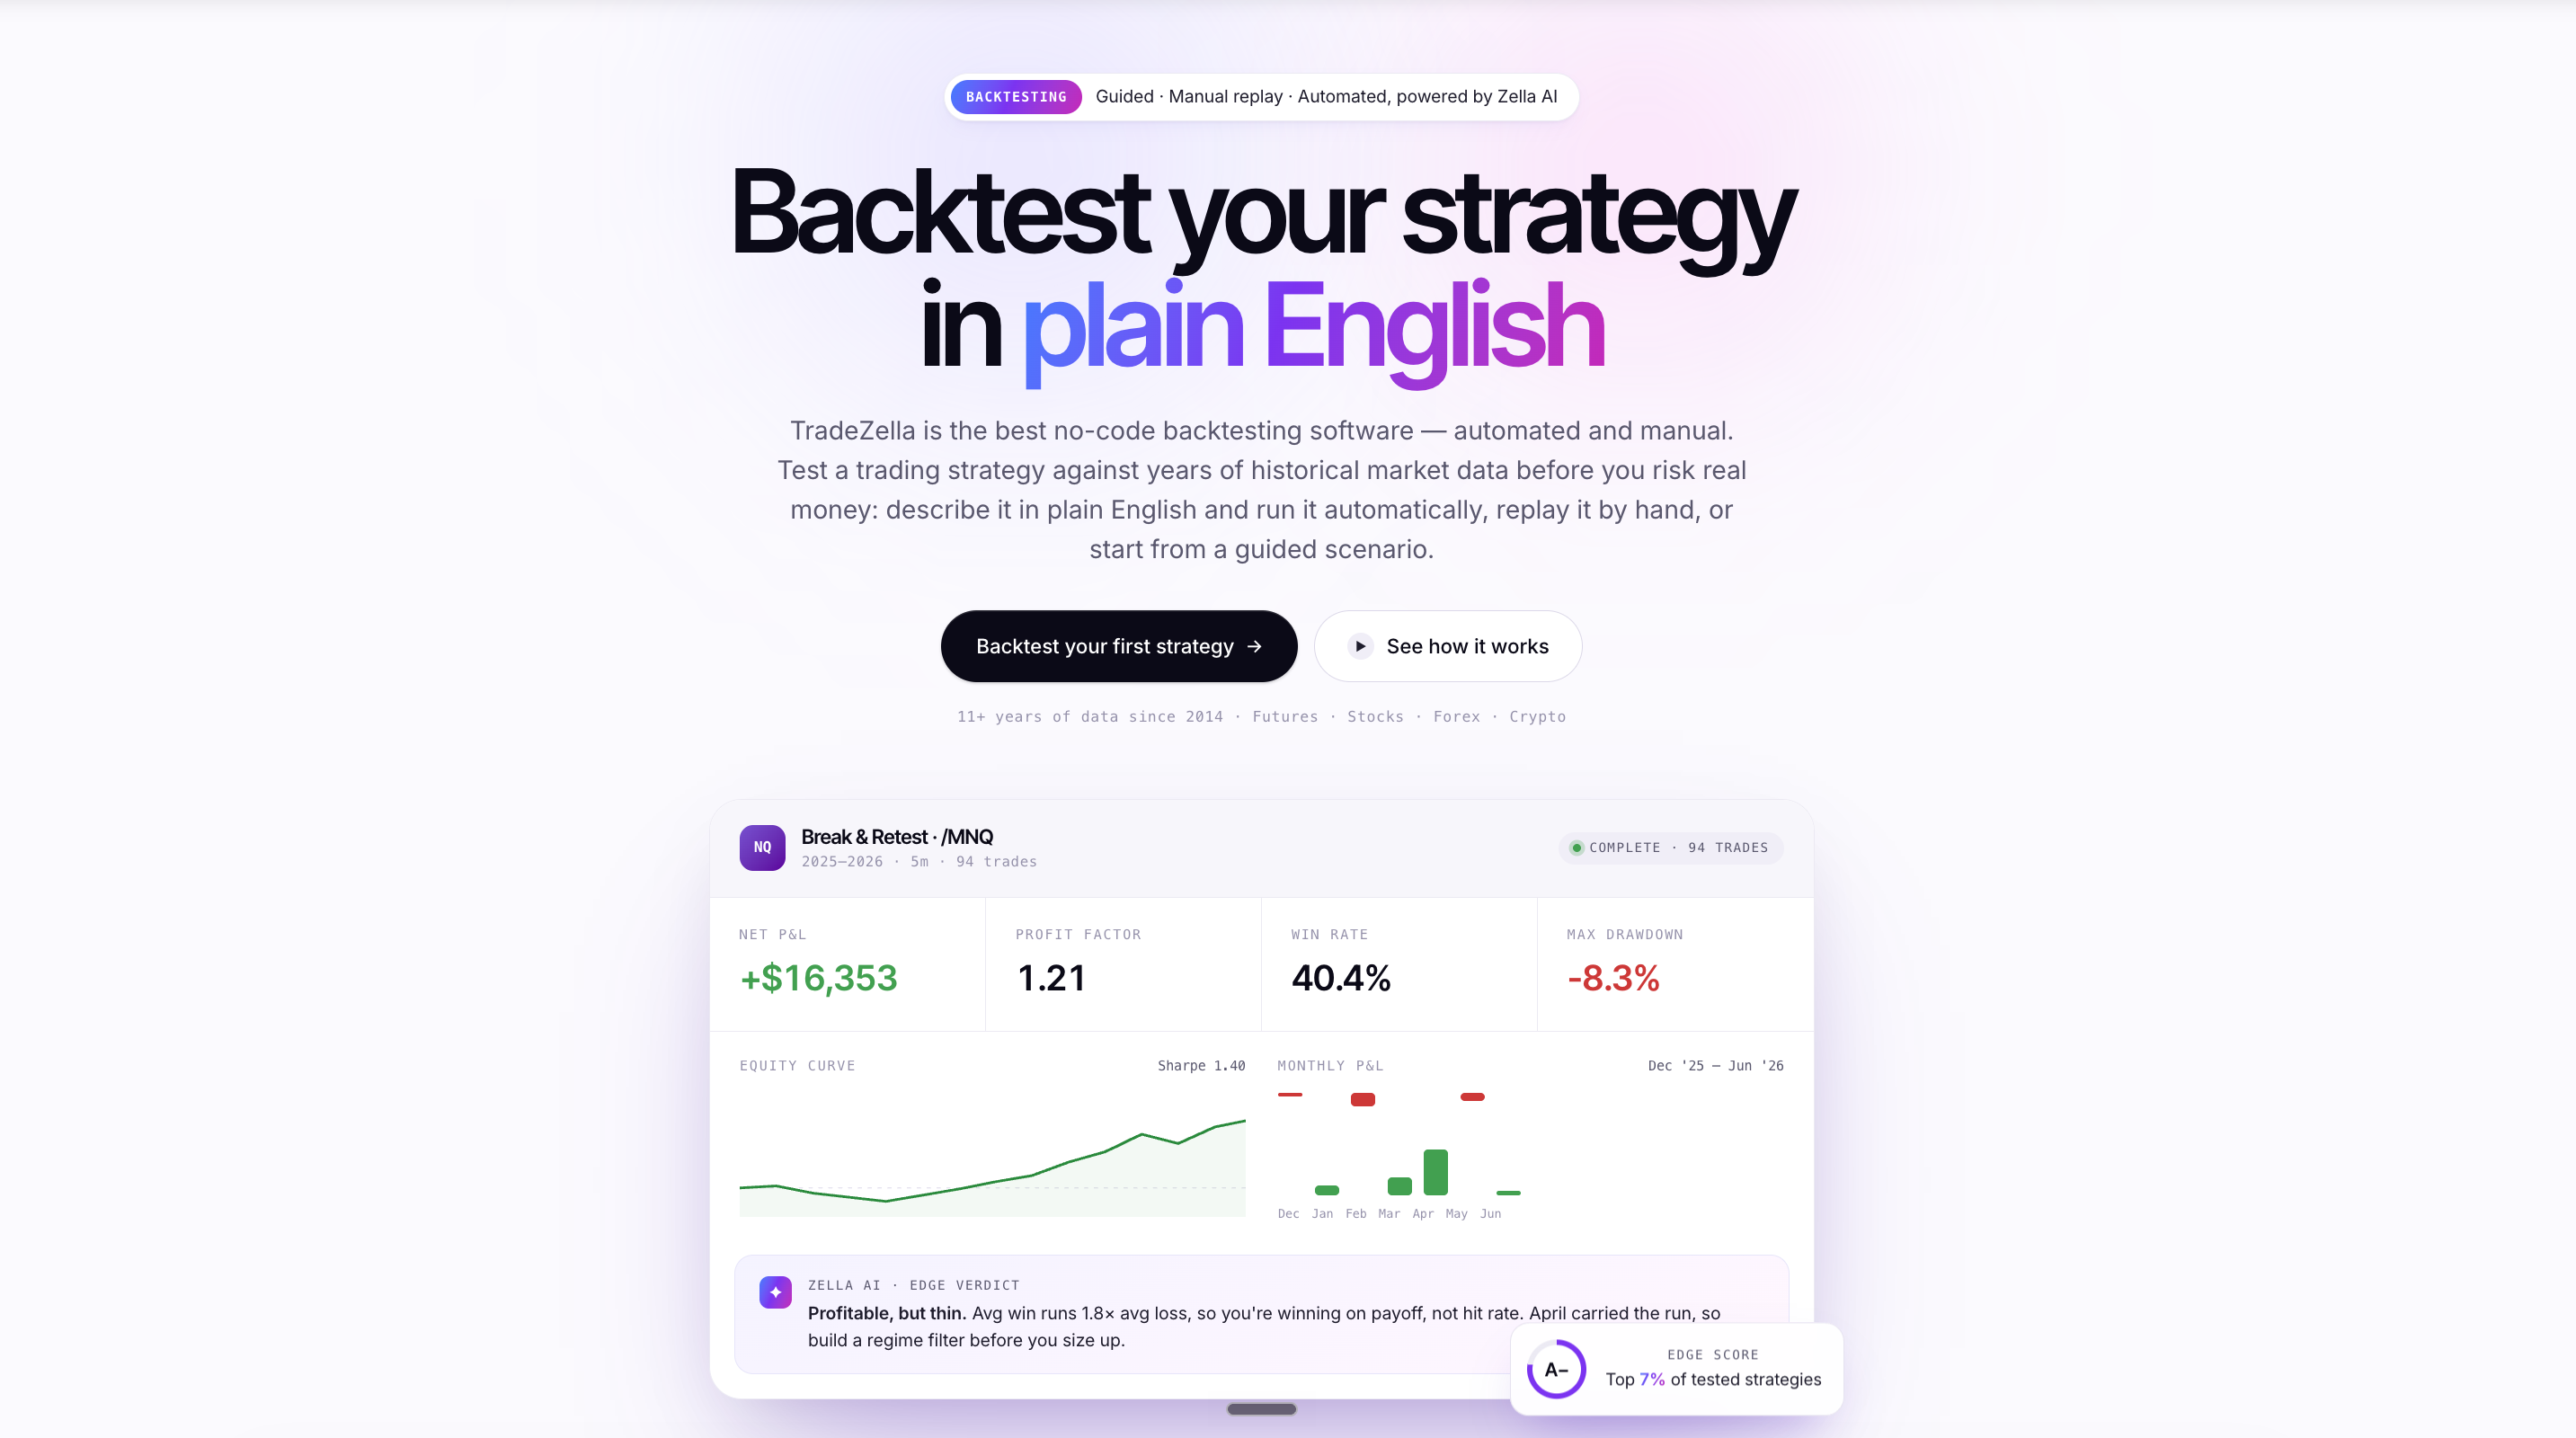
Once the backtest finishes (usually seconds, not minutes), you get a full results dashboard. Here is what matters and how to read it:
Win rate: Percentage of trades that were profitable. Useful but incomplete on its own. A 40 percent win rate with 3R winners is more profitable than a 60 percent win rate with 0.5R winners.
Profit factor: Total gross profit divided by total gross loss. Above 1.3 is a baseline worth investigating. Above 1.5 is strong.
Trading expectancy: Average profit per trade in R-multiples. This is the single number that tells you whether the strategy makes money over time. On a $50,000 account with $500 risk, an expectancy of +0.3R means each trade is worth $150 on average.
Maximum drawdown: The largest peak-to-trough decline during the test. If your max drawdown is 15 percent, ask yourself: can I sit through that without changing my rules?
Equity curve: A visual line showing account growth over time. Smooth and upward is the goal. Spiky or flat sections reveal where the strategy struggled.
Monthly P&L breakdown: How the strategy performed month by month. Look for consistency, not just total return.
Every Individual Trade Is Visible
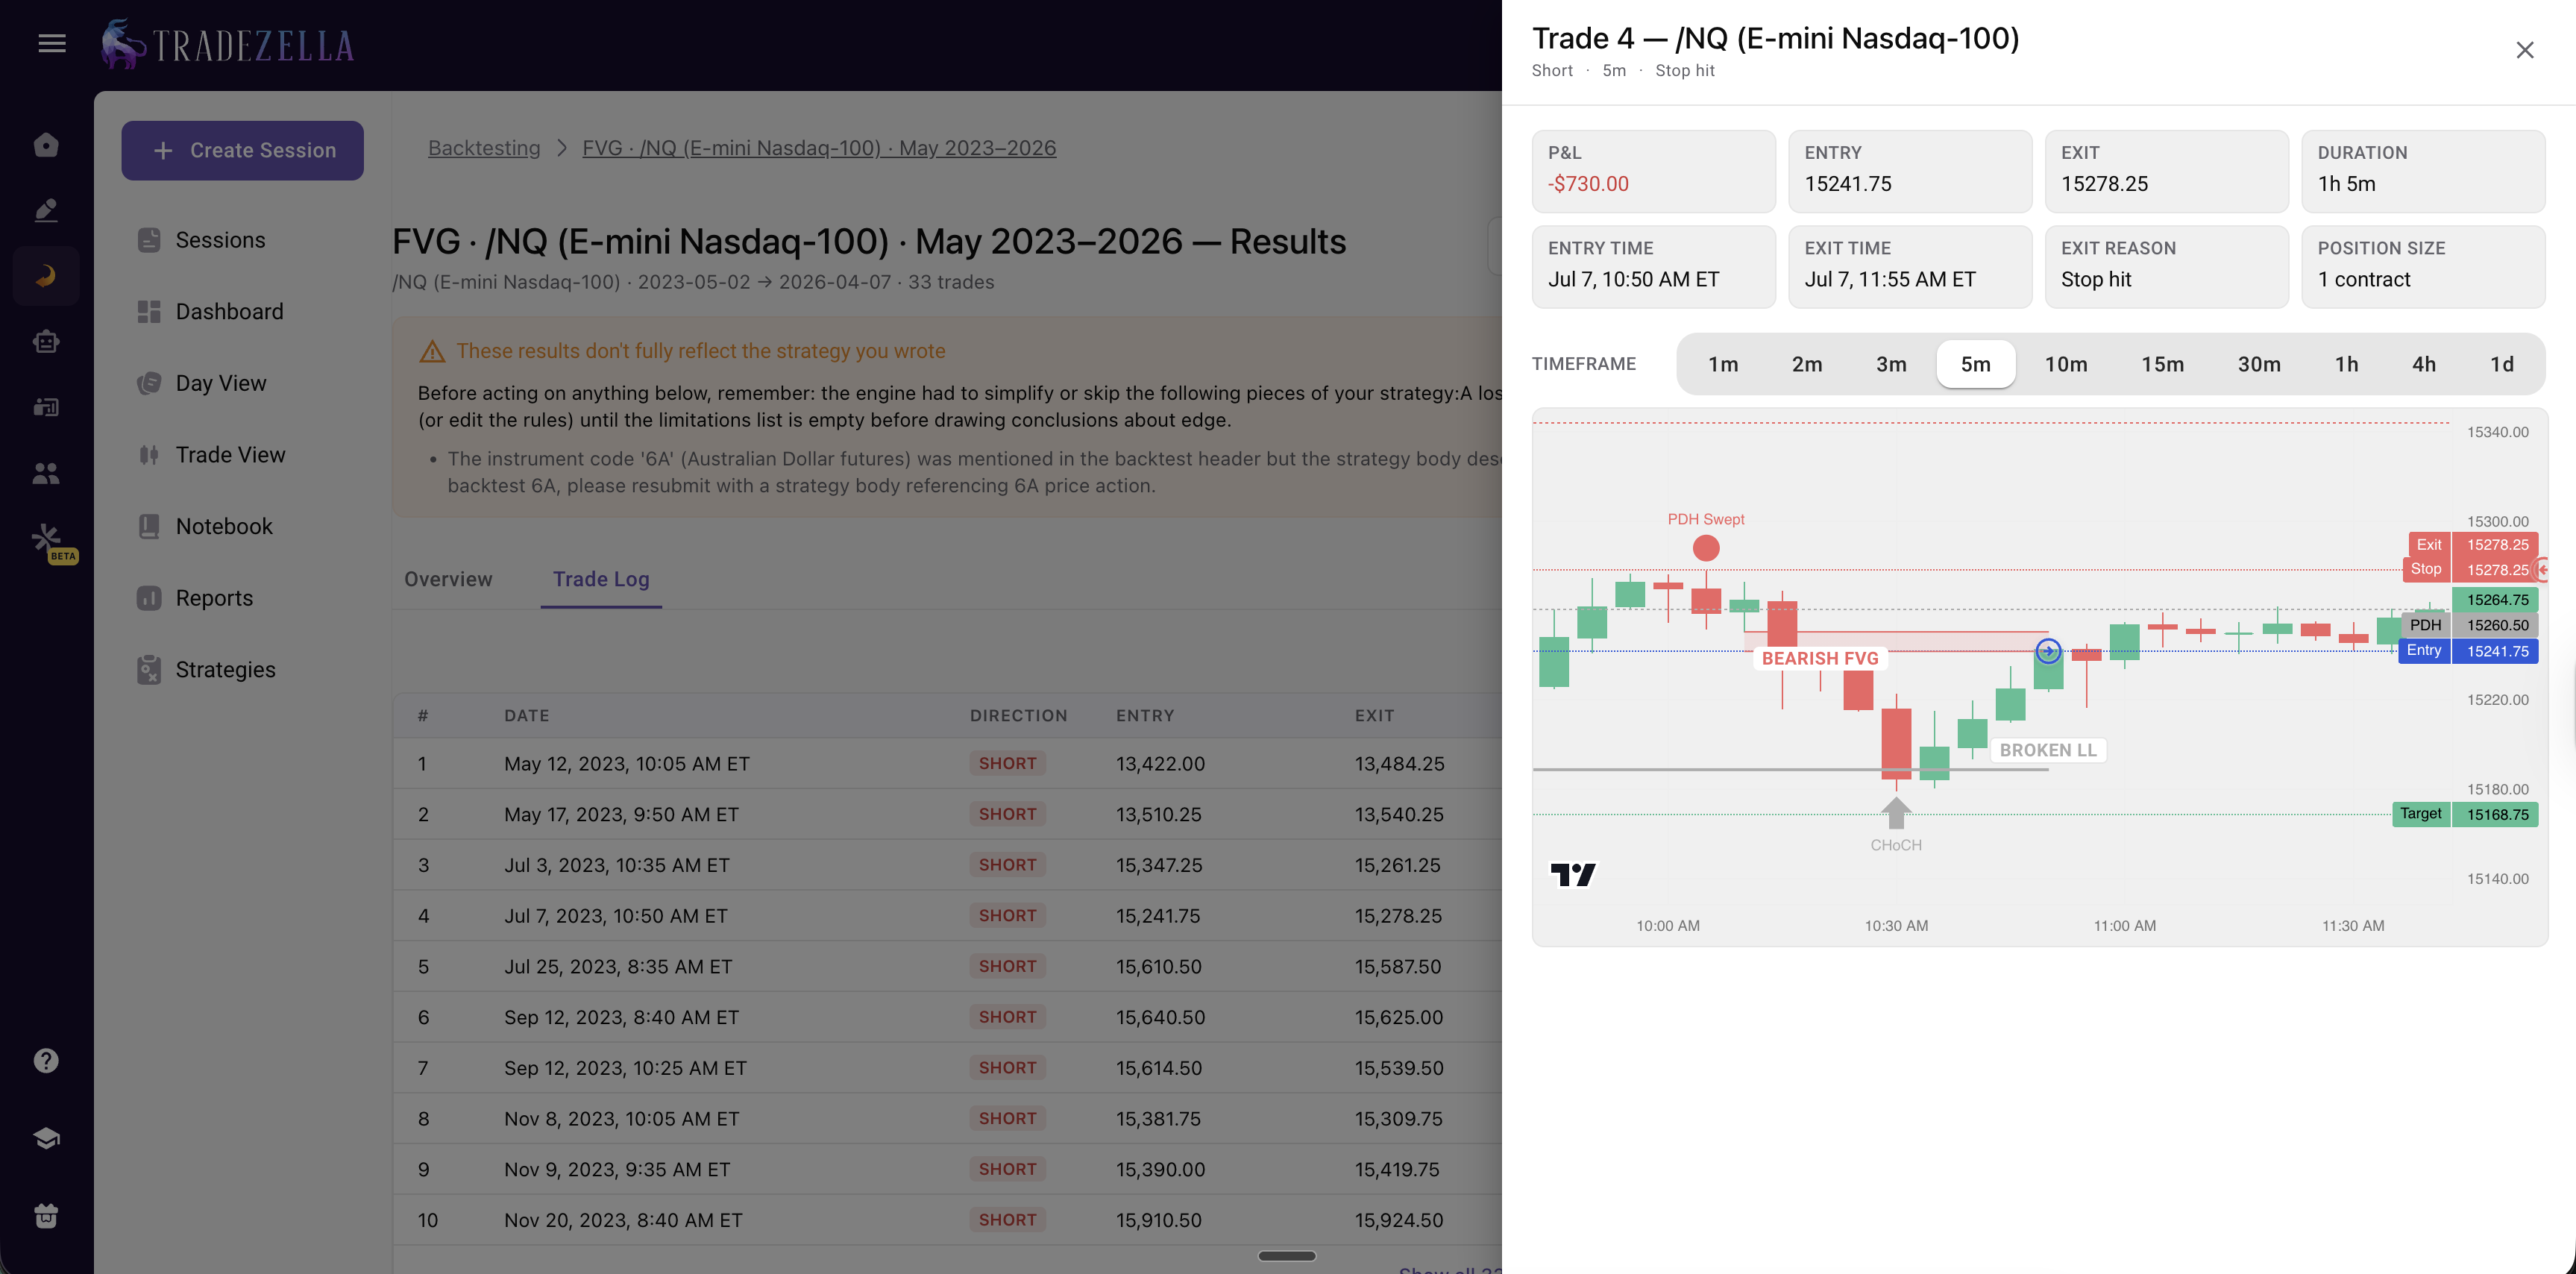
This is where no-code backtesting on TradeZella differs from most alternatives. You do not just see summary statistics. Every individual trade appears in a log with entry price, exit price, stop, target, R-multiple result, and duration. Click any trade to see it on a chart with entry and exit markers.
Why does this matter? Because summary stats hide problems. A strategy might show a 1.4 profit factor overall, but if you click through the trades, you might find that 80 percent of the profit came from three outlier winners. Or you might spot that every losing trade happened during the last hour of the session. These details only appear when you can inspect individual trades.
After your backtest finishes, Zella AI analyzes the results and delivers a verdict. This is not a generic "your strategy is profitable" statement. It is a specific breakdown of what worked, what did not, and what to adjust.
Zella AI might flag that your win rate drops significantly during afternoon sessions, that your average winner barely exceeds your average loser (suggesting tighter profit targets are not helping), or that adding a trend filter would eliminate 30 percent of losing trades. These are insights that would take hours of manual spreadsheet analysis to uncover.
Beyond the initial verdict, Zella AI's agents continue working after you move to live trading. The Auto Trade Tagger applies your tagging criteria to every trade automatically. The Session Review agent compares your morning plan against actual results and journals the day for you. The Market Sentiment Briefing creates pre-market scenarios based on your trading style. These agents turn your backtest findings into live trading discipline without manual effort.
Key Takeaways
No coding required. Describe your strategy in plain English. The platform does the translation.
Pre-built templates accelerate the process. Start with ICT, ORB, trend following, or mean reversion templates and customize from there.
Controls matter. Symbol, session, time period, and risk parameters shape your results. Define them before you test.
Read beyond summary stats. Click into individual trades. The edge (or the problem) is in the details.
Zella AI finds what you miss. Session-specific patterns, filter suggestions, and ongoing analysis after you go live.
Graduate to live trading. 50 percent size, then 75 percent, then full size. Prove the edge survives execution.
Frequently Asked Questions
Do I need to know how to code to backtest a trading strategy?
No. TradeZella lets you describe your strategy in plain English and runs it across years of market data automatically. No Pine Script, Python, or any other programming language required. If you can explain your strategy to another trader, you can backtest it. For a broader look at no-code validation methods including journal-based approaches, see backtest without code.
What types of strategies can I test without code?
Any strategy with definable entry and exit conditions. This includes EMA crossovers, ICT setups like Fair Value Gaps and liquidity sweeps, opening range breakouts, trend following with moving average filters, mean reversion with RSI or Bollinger Bands, chart patterns, gap strategies, and more. Pre-built templates cover the most popular approaches. For a deeper look at automated backtesting concepts, see what is automated backtesting.
How many trades should a backtest include for reliable results?
At minimum, 50 trades give you a rough statistical picture. One hundred trades provide solid confidence. Two hundred or more trades let you filter by session, day of week, or market condition and still have meaningful sub-samples. Automated backtesting makes large samples easy because it runs hundreds of trades in seconds.
What is the Enhance button?
The Enhance button uses artificial intelligence to refine your plain English strategy description before the backtest runs. It identifies vague conditions, fills in missing parameters, suggests additional filters, and tightens your rules into cleaner testable logic. You can review and modify anything it suggests before running the test.
Can I test strategies on stocks, forex, futures, and crypto?
Yes. TradeZella's automated backtesting works across asset classes. You select the instrument, time period, and session when setting up the test. The same strategy can be tested on ES futures, EUR/USD, AAPL, or BTC by changing the symbol in the controls panel. For platform comparisons across different tools, see best backtesting software.
What should I do after getting good backtest results?
Do not trade full size immediately. Practice execution using manual replay, then forward test with 50 percent of your normal position size for 20 to 30 trades. Compare your live results against the backtest. If live performance lands within 15 to 20 percent of backtest expectations, graduate to 75 percent size, then 100 percent. This graduated approach protects capital while confirming the edge.
How does Zella AI analyze backtest results?
After your backtest completes, Zella AI reviews the full results and delivers specific feedback. It identifies session-based performance differences, flags when average winners barely exceed average losers, suggests filters that could eliminate clusters of losing trades, and highlights whether the equity curve shows consistent growth or depends on a few outlier trades. When you move to live trading, Zella AI's agents continue the analysis by auto-tagging trades, reviewing sessions, and comparing live performance against backtest expectations.