Manual vs Automated Backtesting: What's the Difference
Manual vs Automated Backtesting: What's the Difference
Manual backtesting builds intuition but takes months. Automated backtesting runs the same tests in minutes. This guide compares both methods side by side so you can pick the approach that actually improves your trading.
class SampleComponent extends React.Component {
  // using the experimental public class field syntax below. We can also attach
  // the contextType to the current class
  static contextType = ColorContext;
  render() {
    return <Button color={this.color} />
  }
}
Last Updated: July 16, 2026
Manual backtesting is the process of reviewing historical charts bar by bar, marking entries and exits by hand, and recording results in a spreadsheet or journal. Automated backtesting uses software to run predefined trading rules across years of historical data in minutes, generating every individual trade, full performance metrics, and statistical analysis without human intervention. Both methods test whether a strategy has an edge. The difference is how long that test takes and how much you can trust the results.
Here is the reality most traders discover too late. You have a breakout strategy you want to validate. You need at least 100 trades for any statistical confidence. If you backtest manually, scrolling through charts, advancing bar by bar, recording each trade, you are looking at 15 to 30 minutes per trade. That is 40 to 60 hours of work spread across two months of evenings and weekends. If you use automated backtesting, you write the rules, click run, and results appear in minutes. Same strategy. Same data. Same answer. Wildly different time investment.
This article breaks down both methods honestly. Manual backtesting is not worthless. It builds real skills and handles strategies that automated tools cannot. But understanding where each method excels, and where it falls apart, determines whether you spend your limited time building an actual edge or just scrolling through charts.
TL;DR
Manual backtesting builds execution skill but takes 40 to 80 hours for 100 trades and suffers from forward bias. Automated backtesting generates the same results in minutes with perfect consistency. Use automated for statistical validation, manual for execution practice. TradeZella offers both in one platform.
What Is Manual Backtesting?
Manual backtesting is the process of stepping through historical price data one bar at a time, identifying trade setups as they appear, executing entries and exits by hand, and recording the results. It simulates the experience of trading live, except you control the speed. The goal is to test whether your strategy would have made money over a specific period without risking real capital.
Most traders who manually backtest use one of two approaches. The first is chart scrolling: pulling up a historical chart, visually scanning for setups, marking entries and exits, and logging results in a spreadsheet. This is the simplest method but the most vulnerable to forward bias because you can see what happens after your entry before you commit to the trade. The second approach is bar replay, where the software advances the chart one candle at a time, hiding future price action. This is significantly more realistic and is how TradeZella's manual backtesting works.
The Manual Backtesting Process Step by Step
Define your rules. Write down exact entry criteria, stop loss placement, profit target, and position size before opening a chart.
Select an instrument and date range. Pick the asset you trade (ES, NQ, EUR/USD) and choose a historical period. At minimum, cover six months of data across different market conditions.
Start the replay. Begin advancing the chart bar by bar at your chosen speed. Watch price action develop without seeing the future.
Identify a setup. When your entry criteria appear, mark your entry. Place your stop loss and profit target according to your rules.
Track the trade to completion. Continue advancing bars until the trade hits your stop, target, or time-based exit. Record the result.
Log every detail. Entry price, exit price, direction, R-multiple, time of day, setup type, notes on execution. This is where most traders cut corners.
Repeat 50 to 100 times. One trade proves nothing. You need a statistically meaningful sample before drawing any conclusions.
TradeZella Manual Backtesting
How Long Does Manual Backtesting Take?
Honest time estimates for careful manual backtesting, meaning you are using bar replay, not chart scrolling with forward bias:
Per trade: 15 to 30 minutes. Setup identification, execution, recording, and notes.
50 trades: 12 to 25 hours. Roughly two to four weeks of evening sessions.
100 trades: 25 to 50 hours. Six to eight weeks if you are testing after work.
200 trades: Rarely completed. Most traders give up before reaching this sample size manually.
On a $50,000 account with $500 risk per trade, those 100 manual trades represent your attempt to confirm whether a strategy has a real edge before committing real money. The math matters. If your strategy has a profit factor of 1.5 and an expectancy of +0.25R, those 100 trades represent $12,500 in expected profit over time. Spending 50 hours to confirm that edge is reasonable. Spending 50 hours only to discover the edge does not exist is painful. Automated backtesting answers that question in minutes.
TradeZella's Manual Backtesting Features
TradeZella's bar replay lets you manually backtest with tools that most standalone replay platforms lack. You get 0.5x to 10x speed control, all order types (market, limit, stop), auto position sizing based on your risk rules, drag-and-drop stop loss and take profit adjustment, ICT indicators (FVGs, order blocks, breaker blocks), up to 5 symbols across 8 charts simultaneously, an economic calendar overlay, and RTH/ETH session filtering. Every trade you execute in bar replay automatically saves to your journal with full analytics. No spreadsheet required. For a complete walkthrough, see our guide on trade replay software and the broader framework for backtesting trading strategies.
What Is Automated Backtesting?
Automated backtesting is the process of defining trading rules in advance, then letting software execute those rules across historical data without human intervention. The engine scans every bar of historical price data, identifies every instance where your entry criteria are met, simulates the trade from entry to exit, and records the result. Instead of you scrolling through charts and making judgment calls, the software applies your rules with perfect consistency across thousands of bars of data.
The key word is "rules." Automated backtesting requires that your strategy can be expressed as a clear set of conditions. "Buy when the 9 EMA crosses above the 21 EMA and RSI is below 30." "Sell when price sweeps a previous day high and fills a fair value gap." If you can describe it, the software can test it.
TradeZella Automated Backtesting
TradeZella has automated backtesting and here is how it works:
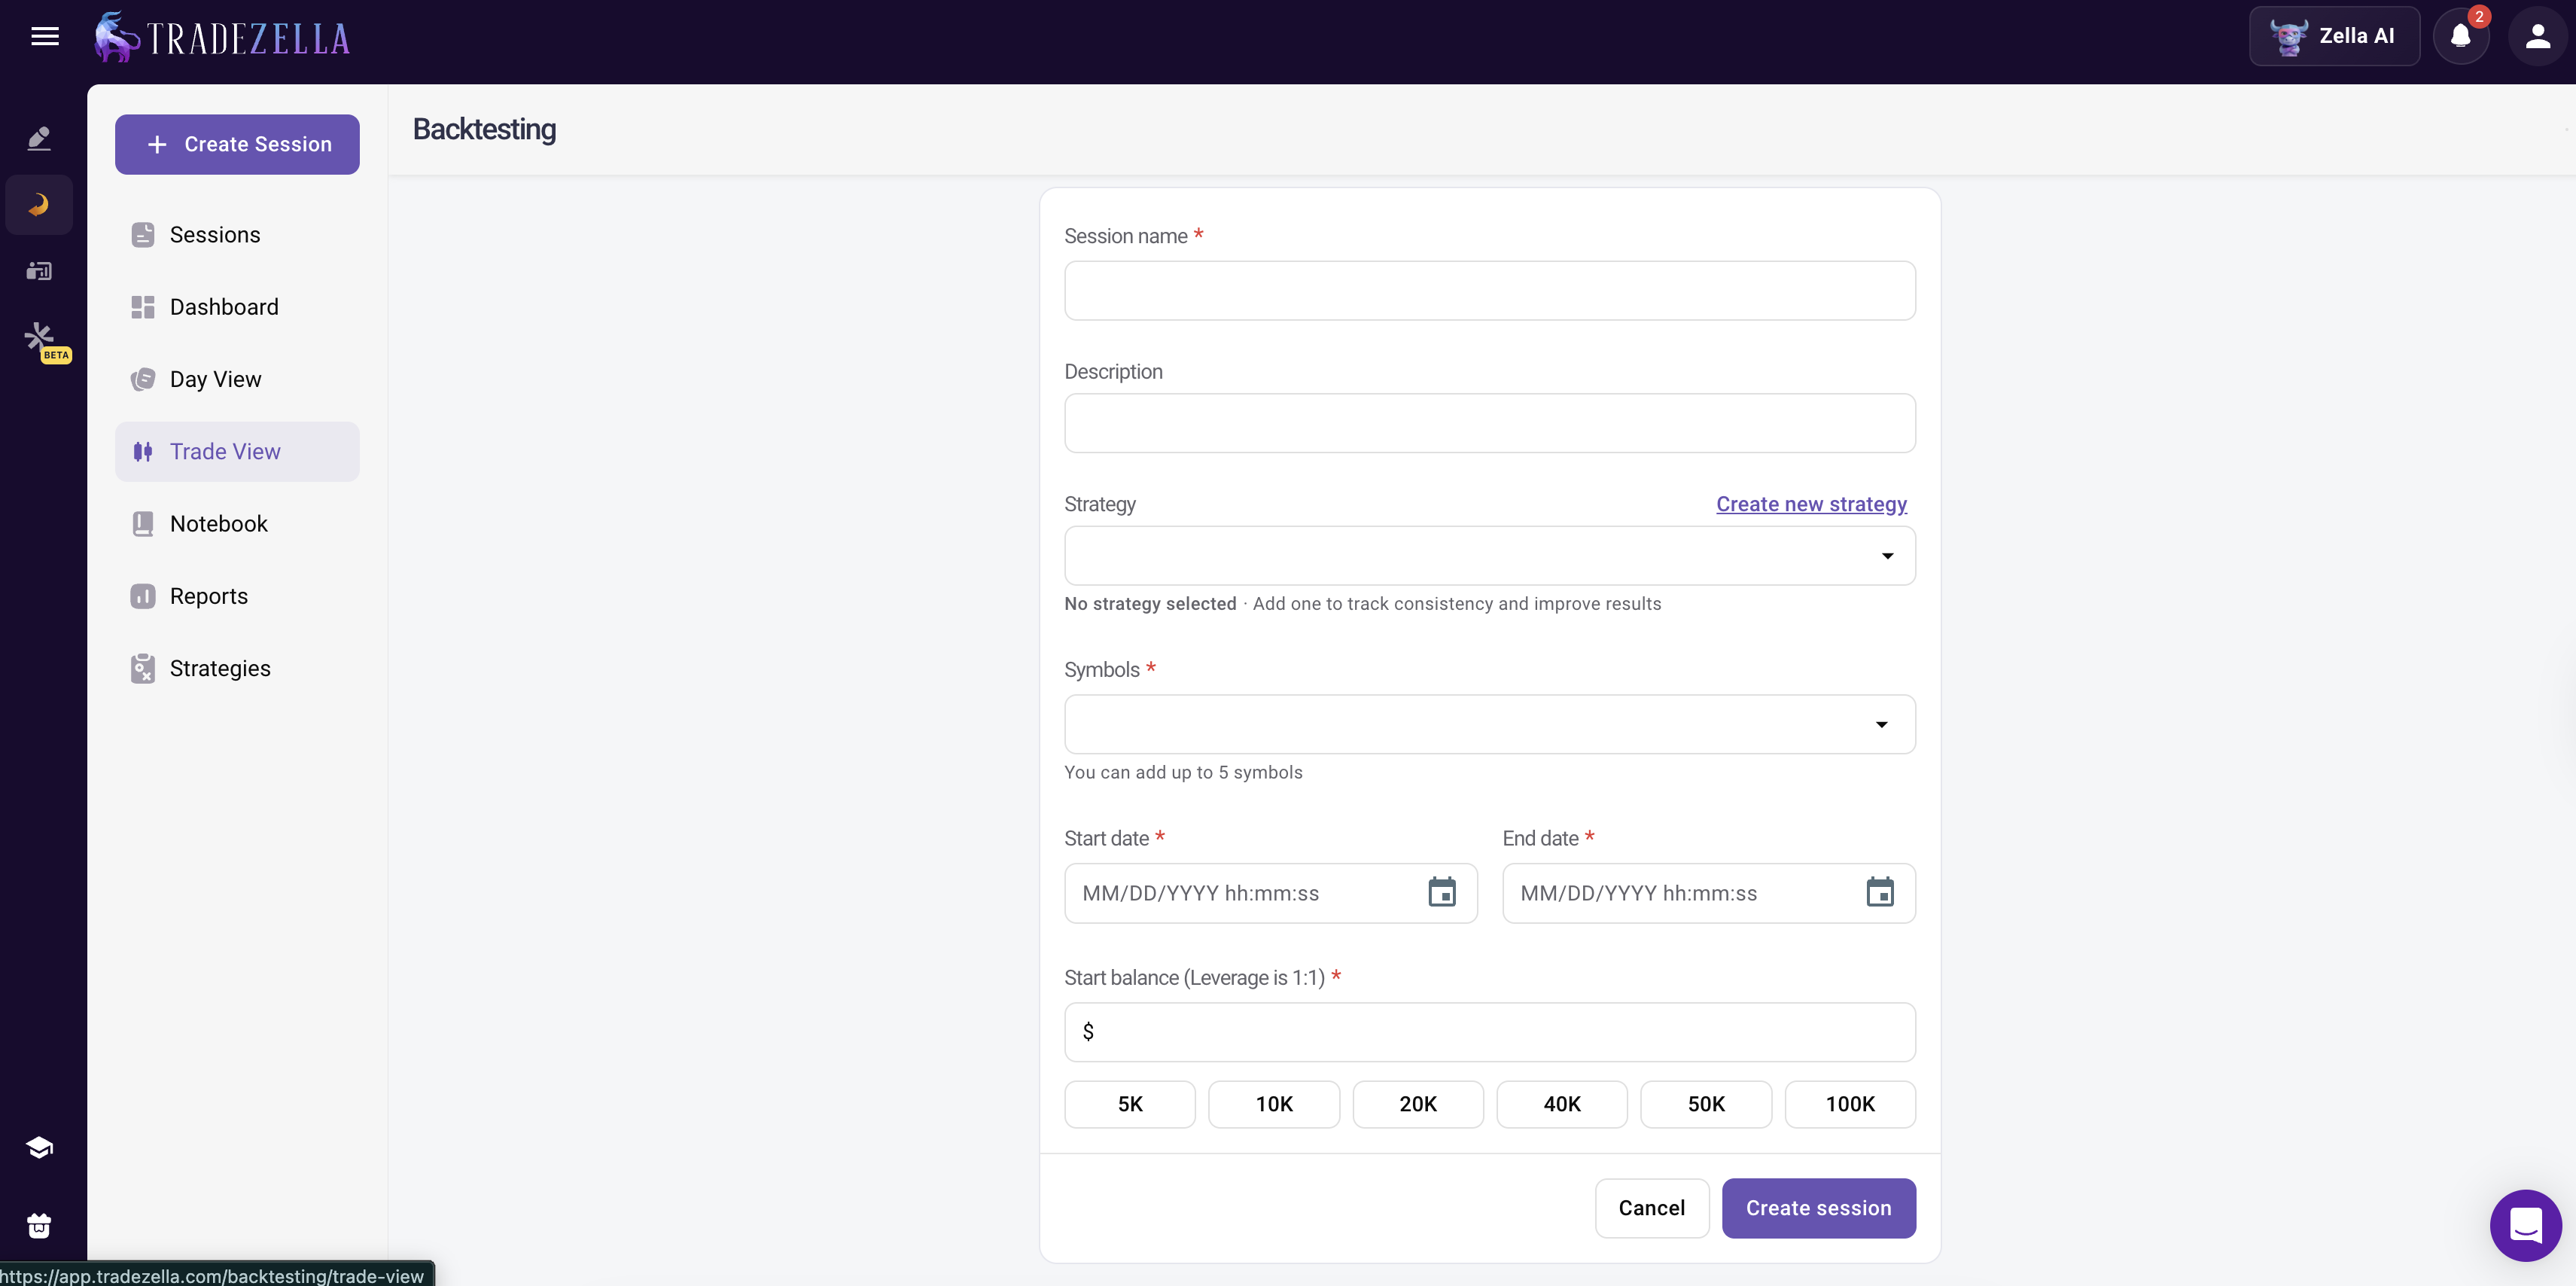
The Automated Backtesting Process Step by Step
Define entry rules. Write the conditions that trigger a trade in plain English. TradeZella has automated backtesting that lets you type rules naturally instead of writing code, so "buy when 9 EMA crosses above 21 EMA" is a valid input.
Define exit rules. Set your stop loss logic (fixed distance, ATR-based, structure level), profit target, and any time-based exits.
Select instrument and date range. Pick ES, NQ, EUR/USD, AAPL, or any supported asset. Select years of historical data to test against.
Run the test. Click run. The engine processes every bar across your selected data range and generates every trade that matches your rules.
Review every individual trade. This is critical. Unlike some platforms that show only summary stats, TradeZella displays every individual trade the engine found, with entry price, exit price, R-multiple, and time stamp. You can verify the trades are real and realistic.
Analyze the metrics. Win rate, profit factor, expectancy, maximum drawdown, largest winner, largest loser, average hold time. All calculated instantly.
Iterate. Change one variable (stop distance, entry filter, time of day restriction) and re-run in seconds. This is where automated backtesting creates the biggest advantage.
TradeZella Automatic Backtesting Dashboard
Pre-Built Templates
Not every trader wants to write rules from scratch. TradeZella includes pre-built templates for popular strategies, including ICT concepts, Opening Range Breakout, trend following, and mean reversion. You can run a template as-is to see how it performs on your preferred instrument, then customize the parameters. A trader testing a gap and go strategy can start with the ORB template, adjust the opening range window, and have results in minutes.
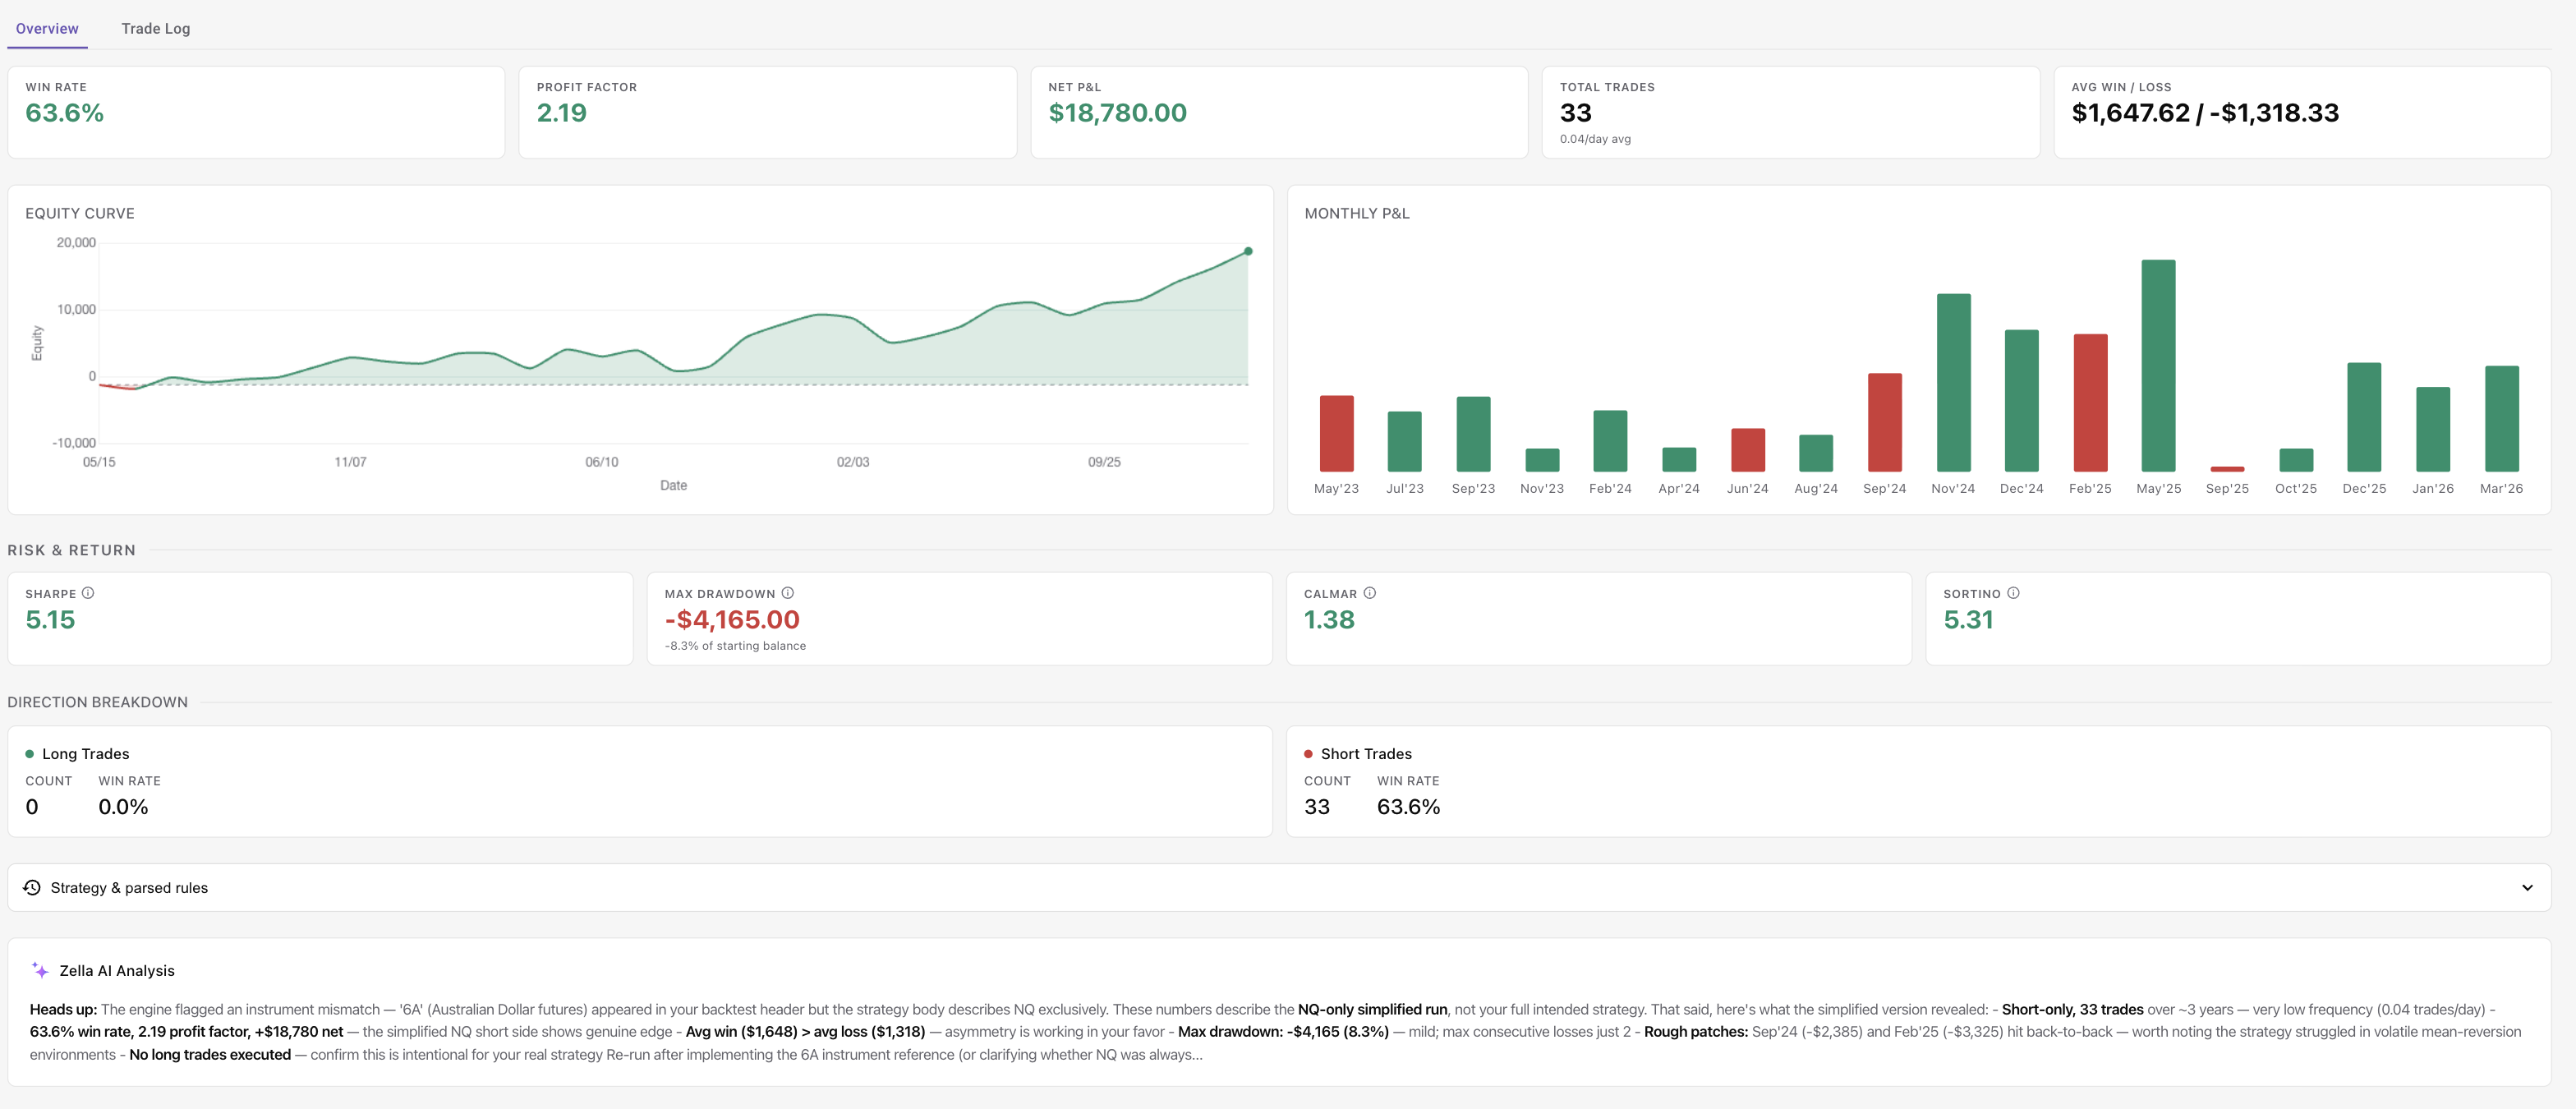
Zella AI Analysis
After an automated backtest completes, Zella AI, TradeZella's built-in AI trading partner, analyzes the results and identifies patterns and opportunities that raw numbers might hide. If your backtest shows a 52 percent win rate overall but a noticeably higher win rate during certain hours, Zella AI flags that insight. You can then re-run the test with a time filter to validate the finding. For a detailed walkthrough of the platform's backtesting capabilities, see backtest with TradeZella.
How Does Manual Backtesting Compare to Automated?
The short answer: they solve different problems. Manual backtesting builds skill and handles discretionary judgment. Automated backtesting provides speed, scale, and statistical confidence. Here is how they compare across every dimension that matters.
Speed
Manual: 15 to 30 minutes per trade. 100 trades takes 25 to 50 hours. Automated: 30 minutes to write rules and configure the test. The engine scans your full date range and generates results quickly. The time savings multiply as your sample size grows. At 500 trades, manual backtesting is practically impossible (200+ hours). Automated handles it in the same time it takes to run any other test.
Sample Size
Manual: 50 to 100 trades is the realistic ceiling for most traders. Very few complete 200. Automated: 500+ trades is standard. Some tests generate 1,000+ trades across multiple years. Larger samples mean more reliable statistics. A 50 percent win rate based on 50 trades could easily be 40 percent or 60 percent due to variance. That same win rate based on 500 trades is far more stable.
Consistency
Manual: trade number 1 gets careful analysis. Trade number 80 gets a quick glance because you are tired. Fatigue, boredom, and mood all affect how consistently you identify and execute setups. Automated: trade number 1 and trade number 500 are evaluated with identical criteria. The engine does not get tired, skip trades it does not feel like taking, or bend the rules because the last three trades lost.
Discretionary Elements
Manual: captures the "feel" that experienced traders develop. "This breakout looks weak, I would skip it." "The momentum feels exhausted." These judgment calls cannot be coded into rules, and they matter for discretionary strategies. Automated: executes rules as written. If the conditions are met, the trade is taken. No exceptions. This is a strength for rule-based strategies and a limitation for strategies that rely on trader intuition.
Multi-Instrument Testing
Manual: one instrument at a time. Testing your breakout strategy on ES, then NQ, then YM means tripling your time investment. Automated: run the same rules on different instruments with separate tests. If your strategy works on ES but fails on NQ, you know in minutes instead of months. Traders testing scalping strategies benefit particularly from this, since scalping setups need to be validated across multiple assets and sessions to confirm they are not instrument-specific flukes.
Optimization
Manual: want to test whether a 2 ATR stop works better than a 1.5 ATR stop? Redo all 100 trades. That is another two months. Automated: change the stop loss parameter, click run, get the answer in seconds. This ability to iterate rapidly is how traders find the specific conditions where their strategy performs best.
Learning Value
Manual: high. Scrolling through hundreds of bars of price action builds chart reading skill, pattern recognition, and intuition that no automated test can replace. You learn to see how price behaves around your setups, how fake breakouts look different from real ones, and how volume confirms or denies a move. Automated: low for skill building, but high for data-driven confidence. You learn what works statistically, not visually.
Cost of Mistakes
Manual: forward bias is the biggest risk. Even with bar replay, it is possible to accidentally glance ahead, or to subconsciously remember how a chart played out. This inflates your results and gives you false confidence. Automated: forward bias is eliminated because the software processes bars sequentially without showing the future. The automated risk is curve fitting, which is over-optimizing rules to match historical data. Both mistakes are dangerous, but forward bias is harder to detect because you might not realize you are doing it.
Dimension
Manual Backtesting
Automated Backtesting
Winner
Speed
15-30 min per trade, 50+ hours for 200 trades
Minutes to set up, seconds to run
Automated
Sample Size
50-100 trades realistic
500+ trades easy
Automated
Consistency
Varies with fatigue and mood
Identical every run
Automated
Forward Bias Risk
High (you see future price action)
Eliminated (software enforces rules)
Automated
Discretionary Strategies
Can capture subjective entries
Rule-based only
Manual
Learning Value
High (builds chart reading)
Low (just shows results)
Manual
Optimization Speed
Test one variation at a time
Change one variable, re-run in seconds
Automated
Multi-Instrument Testing
One instrument at a time
Same rules across 10+ symbols
Automated
When Does Manual Backtesting Still Make Sense?
Automated backtesting is faster. It is more consistent. It generates larger sample sizes. But faster does not always mean better. There are four situations where manual backtesting is the right choice, or at least a critical supplement to automated testing.
Learning to Read Price Action
If you are within your first year of trading, manual backtesting teaches you to see the market. You learn how price interacts with support and resistance, how candle patterns form, how momentum shifts before a reversal. Automated backtesting gives you an answer ("this strategy has a 54 percent win rate") but not the visual experience of watching 200 setups play out. Beginners should start with manual testing to build their chart literacy, then graduate to automated testing for scale. For traders working on recognizing trading patterns, there is no substitute for seeing those patterns develop in real time through bar replay.
Discretionary Strategies with Subjective Entries
Some strategies cannot be reduced to rules. "Enter when the trend looks extended and a reversal candle forms at a key level." What counts as "extended"? What qualifies as a "key level"? These require human judgment that no rule engine can replicate. If your strategy depends on tape reading, order flow interpretation, or visual confluence of multiple factors, manual backtesting is the only way to test it honestly. Our guide to backtesting without code covers journal-based validation methods specifically designed for discretionary strategies.
Small Sample Verification
After running an automated test that generates 500 trades, manually replay 20 to 30 of them. Check: were the entries realistic? Would you have actually seen the setup in real time? Did the engine enter at prices you could have gotten with real execution? This manual spot-check catches issues that automated testing cannot, like entries on low-liquidity bars where the fill would have been impossible, or setups that looked obvious in hindsight but were buried in noise during the actual session.
Building Confidence Before Going Live
Knowing that your strategy has a 1.5 profit factor across 500 trades is intellectually reassuring. But watching yourself execute those trades in bar replay, seeing the losses happen and staying in the game, feeling the discomfort of a drawdown and sticking to the rules anyway, builds emotional confidence that no spreadsheet can provide.
The Real Answer: Use Both
Manual for learning and validation. Automated for scale and statistical confidence. The traders getting the most out of backtesting are not choosing one or the other. They are running automated tests to find strategies with an edge, then manually replaying a subset of those trades to confirm the results are realistic and to build the execution skills needed to trade the strategy live.
Why Are Traders Switching to Automated Backtesting?
Manual backtesting was the only option for years. Now that automated tools can handle rule-based testing with every individual trade visible, the case for spending months on manual testing alone is getting harder to make. Here is why the shift is happening.
Forward Bias Is the Number One Killer of Manual Backtesting
Forward bias means you know what happens next on the chart. Even with bar replay, your eyes can drift to the right side of the screen. You might subconsciously remember a chart pattern from a previous review. You might enter a trade you would have skipped live because you already know it works out. Studies on manual backtesting show that traders consistently overestimate their strategy's win rate by 5 to 15 percent when forward bias is present. On a $50,000 account with $500 risk per trade, that 10 percent win rate inflation turns a breakeven strategy into one that looks like it makes $12,500 over 100 trades. You go live expecting profits and find losses instead. Automated backtesting eliminates this entirely because the engine processes data sequentially without displaying future bars.
The Sample Size Problem
Fifty trades is not enough to confirm an edge. The margin of error on a 50-trade test is enormous. A strategy with a true 50 percent win rate could easily show 40 percent or 60 percent over 50 trades just from random variance. You need 100 trades for reasonable confidence and 200+ for strong statistical validity. Getting to 200 trades manually takes most traders 3 to 4 months. By then, they have either lost motivation, lost discipline in their recording, or the market conditions have shifted. Automated testing scans years of data across different market regimes and delivers results in minutes. The best backtesting software comparison breaks down which platforms handle large sample sizes best.
Consistency Across the Entire Sample
Manual backtesting degrades over time. Trade number 5 gets careful analysis, detailed notes, and honest execution. Trade number 85 gets a quick "close enough" and sloppy recording because you have been at this for six weeks and want to finish. This inconsistency corrupts your results. The first 20 trades might reflect your actual strategy while the last 20 reflect a tired, impatient version of it. Automated backtesting applies the same criteria to every bar of data with zero degradation. This matters more than most traders realize.
Speed of Iteration
Here is where automated backtesting creates exponential value. After your first 100-trade test, the interesting questions start. What if I use a 2 ATR stop instead of 1.5 ATR? What if I only take trades before 11 AM? What if I add a volume filter? Each of these questions requires a full re-test. Manually, each variation takes another two months. Automated, you change one parameter and re-run in seconds. A trader who tests 10 variations in an afternoon learns more about their strategy than a trader who tests one version in two months. This iterative process is how you find your trading edge.
Multi-Instrument Validation
A breakout strategy that works on ES might fail on NQ. A mean reversion setup that works on EUR/USD might fail on GBP/JPY. Manual backtesting tests one instrument at a time, making cross-instrument validation impractical. Automated backtesting lets you run the same rules on any supported instrument with separate tests. If you are forex backtesting a London open strategy, you can test it across EUR/USD, GBP/USD, AUD/USD, and more. If you are backtesting stocks, you can test a breakout setup on AAPL, MSFT, NVDA, and TSLA individually. Multi-instrument validation separates strategies with a real edge from strategies that happened to work on one asset during one period.
The Dollar Case
A trader discovers via a 500-trade automated test that their breakout strategy only produces positive expectancy during the first two hours of the regular session. Before that insight, they were trading all day. After implementing the time filter, they eliminate afternoon trades that were costing them an average of $300 per week. On a $50,000 account with $500 risk per trade, that is $15,600 in saved losses per year. The edge was always there, but the sample size required to detect it (500 trades filtered by time of day) was unreachable through manual testing alone. Proper risk management starts with knowing exactly when and where your strategy works.
How to Combine Manual and Automated Backtesting
The strongest backtesting workflow uses both methods in sequence. Automated testing provides the statistical foundation. Manual testing validates that the statistics reflect realistic trading. Here is the four-step framework.
Step 1: Run the Automated Test First
Define your rules in plain English. Select your instrument and a date range covering at least two years (to capture both trending and ranging markets). Run the test. Target a minimum of 200 trades. Review the summary metrics: win rate, profit factor, expectancy, maximum drawdown, average winner versus average loser. If the strategy does not clear minimum thresholds (profit factor above 1.3, expectancy above +0.2R, max drawdown below 15 percent of account), stop here. There is no point manually validating a strategy that already fails the numbers test. Revisit the broader framework in our guide on how to backtest a trading strategy.
Step 2: Manually Replay 20 to 30 Flagged Trades
From the automated test results, select 20 to 30 trades for manual review. Pick a mix: some winners, some losers, some trades near key levels, and any trades that seem unusual (very large wins or entries at suspicious prices). Replay each trade in bar-by-bar mode and ask three questions. First: would I have seen this setup in real time, or is it only obvious in hindsight? Second: was the entry price realistic, or did it depend on a thin liquidity bar that would have slipped in live trading? Third: would I have actually taken this trade given the surrounding context, or would I have hesitated? If more than 20 percent of your manually reviewed trades fail these checks, the automated results are overstating the strategy's edge.
Step 3: Forward Test with Reduced Size
If the automated stats are strong and the manual review confirms the trades are realistic, start a forward test. Trade the strategy on a demo account or at 50 percent of your normal position sizing for 20 to 30 trades. Compare your live results to the backtest metrics. Your live win rate should be within 15 to 20 percent of the backtest win rate. If the backtest showed 55 percent win rate and your live test shows 40 percent, something is off. Either the backtest is optimistic, or your live execution is introducing errors. Review the gap using your trade review process before scaling up.
Step 4: Scale Into Full Size
Once your forward test confirms the backtest within tolerance, scale to full position size. On a $50,000 account, move from $250 risk per trade (50 percent) to $500 over the next 20 trades. Continue tracking results in your journal, and compare backtest versus live performance monthly. If the live results diverge significantly from the backtest over 50+ trades, run the automated test again on recent data. Markets evolve, and a strategy that worked in 2024 data may need adjustment for 2026 conditions. Use the Monte Carlo Simulator to stress-test your results and understand the range of possible outcomes before committing full capital.
TradeZella handles this entire workflow inside one platform. Automated backtesting generates the statistical baseline. Bar replay validates individual trades manually. Live journal tracks the forward test with full analytics. The Position Size Calculator manages your graduated sizing. And every individual trade from your automated backtest is visible with full details, so you can verify the results are realistic before going live.
What Metrics Should You Track During Backtesting?
Whether you test manually or use automated backtesting, the metrics that matter are the same. The difference is how quickly and accurately you can calculate them. Here are the six metrics that determine whether a backtest result is tradeable.
Win Rate
The percentage of trades that are profitable. Most consistently profitable strategies operate between 40 and 60 percent. A 40 percent win rate is fine if your average winner is two to three times larger than your average loser. Automated backtesting calculates this instantly across any sample size. Manual backtesting requires you to count winners and losers from your spreadsheet.
Profit Factor
Total gross profits divided by total gross losses. A profit factor above 1.0 means the strategy is profitable. Above 1.3 is the minimum threshold for a tradeable strategy. Above 1.5 is strong. Above 2.0 is excellent but may indicate curve fitting if achieved through over-optimization. On a $50,000 account, a profit factor of 1.5 across 100 trades means for every dollar lost, you made $1.50 back.
Expectancy Per Trade
Trading expectancy tells you how much you expect to make or lose on an average trade, expressed in R-multiples. An expectancy of +0.25R means you expect to make 0.25 times your risk per trade on average. On $500 risk, that is $125 expected per trade. Over 100 trades, that is $12,500 in expected profit. Any strategy with negative expectancy is a losing strategy regardless of win rate.
Maximum Drawdown
The largest peak-to-trough decline during the backtest period. Keep this below 15 percent of your account for personal trading and below 5 to 8 percent for prop firm evaluations. On a $50,000 account, a 10 percent max drawdown means the strategy lost $5,000 from its peak before recovering. Track this in R-multiple terms as well. A max drawdown of -10R means you went through a period of losing 10 times your risk per trade before recovering.
Average Winner vs Average Loser
This ratio determines how much room you have if your win rate drops in live trading. If your average winner is $750 and your average loser is $450, your risk-reward ratio is 1.67:1. Combined with a 50 percent win rate, that yields a profit factor of 1.67. If live trading drops your win rate to 45 percent, you are still profitable. If your average winner and loser are equal (1:1), a 50 percent win rate is breakeven before costs.
Largest Single Loss
This should not exceed your planned risk by more than 20 percent. If you risk $500 per trade, your largest loss should be $600 or less. A single loss of $1,200 on a $500 risk trade means your stop loss strategies are failing. Either the stop is being skipped, or you are moving it further from your entry during the trade. Both problems are more common than most traders admit.
Track all six metrics on your trading dashboard alongside your live trading results. The comparison between backtest metrics and live metrics is the clearest indicator of whether your execution matches your plan.
What Mistakes Should You Avoid When Backtesting?
Both manual and automated backtesting can produce misleading results if you make these common errors. Some mistakes are unique to one method, and some are shared. Here is what to watch for.
Forward Bias (Manual Risk)
Seeing future price action before committing to a trade. This is the most dangerous backtesting error because it is invisible. You do not realize you are doing it. Even experienced traders subconsciously adjust their entries when they can see the next few bars. The fix: always use bar replay with hidden future bars. Never chart-scroll as your primary testing method. Automated backtesting eliminates this entirely, which is its single biggest structural advantage over manual testing.
Curve Fitting (Automated Risk)
Over-optimizing rules to match historical data. If you keep tweaking parameters until the backtest looks perfect (80 percent win rate, 3.0 profit factor), you have likely fitted the rules to past noise rather than finding a real edge. The fix: keep rules simple (5 or fewer conditions), test out-of-sample data (train on 2022-2024, test on 2025), and be suspicious of any backtest result that looks too good. A legitimate edge usually shows a profit factor between 1.3 and 2.0. Anything above 2.5 deserves skepticism unless the sample is very large.
Insufficient Sample Size (Shared)
Testing 20 trades and calling it valid. The minimum for any meaningful conclusion is 50 trades. The target should be 100+ for manual and 200+ for automated. The reason automated needs more: with a larger sample, you can also filter by time of day, market condition, or instrument to see if the edge is consistent across sub-groups. A 200-trade sample lets you split into morning and afternoon subsets of 100 each and check if the edge holds in both periods.
Ignoring Transaction Costs (Shared)
Spreads, commissions, and slippage eat into every trade. A strategy that shows +$50 per trade before costs might show +$20 after costs. On scalping strategies with small targets, transaction costs can turn a winner into a loser. Always include realistic cost estimates in both manual and automated tests. For ES futures, budget $5 to $10 round turn. For stocks, budget your per-share commission plus average slippage.
Testing One Market Condition Only (Shared)
Running a backtest exclusively on a strong uptrend and concluding the strategy works. Test across trending markets, ranging markets, volatile markets, and quiet markets. If your date range only covers January to March 2025 (a strong rally), your results do not represent what happens during a correction or choppy period. Use a minimum of 12 months of data, ideally 24+ months.
Changing Rules Mid-Test (Shared)
Starting with one set of rules, noticing the results are bad, adjusting the rules on trade 30, and continuing to trade 100. Now you have 30 trades of one strategy and 70 trades of another, and neither sample is large enough to mean anything. This is a trading discipline problem that affects manual testing more than automated testing. With automated backtesting, the temptation is to run a new test with different rules, which is fine, as long as you treat each run as a separate test rather than combining them.
Key Takeaways
Manual backtesting takes 25 to 50 hours for 100 trades. Automated backtesting delivers results in minutes once you write the rules.
Forward bias is manual backtesting's biggest weakness. Automated testing eliminates it structurally because the engine never shows future price data.
Curve fitting is automated backtesting's biggest risk. Keep rules simple, test out-of-sample data, and be skeptical of results that look too perfect.
Manual backtesting builds skills that automated testing cannot. Chart reading, pattern recognition, and emotional preparation all come from watching trades play out in real time.
The best workflow uses both methods. Automated first for statistical baseline, manual second for validation, then forward testing at reduced size before going live.
Sample size determines reliability. Target 100+ trades for manual, 200+ for automated. Fifty trades is not enough to confirm an edge.
Speed of iteration is automated testing's hidden advantage. Testing 10 strategy variations in an afternoon teaches you more than testing one variation over two months.
Frequently Asked Questions
Can I backtest without coding?
Yes. TradeZella has automated backtesting that lets you write trading rules in plain English instead of code. You type conditions like "buy when the 9 EMA crosses above the 21 EMA and RSI is below 30" and the engine translates them into executable rules. Pre-built templates for ICT concepts, Opening Range Breakout, and other popular strategies are also available so you can start testing without writing any rules at all. Manual backtesting through bar replay also requires no coding. For a deeper look at journal-based testing methods, see our guide on backtesting without code.
How many trades do I need for a valid backtest?
A minimum of 50 trades for any meaningful conclusion, with 100 as the target for manual backtesting and 200 or more for automated backtesting. At 50 trades, the margin of error on your win rate is roughly plus or minus 14 percentage points, meaning a measured 50 percent win rate could actually be anywhere between 36 percent and 64 percent. At 200 trades, that margin drops to about 7 percentage points. Larger samples allow you to filter by time of day, market condition, or instrument while still maintaining statistical significance within each sub-group.
Does automated backtesting work for discretionary strategies?
Automated backtesting works for the rule-based components of discretionary strategies but cannot replicate subjective judgment calls. If your strategy includes conditions like "enter when the trend looks exhausted" or "skip the trade if the market feels choppy," those elements require human evaluation. The practical approach is to automate what you can (indicator conditions, time filters, risk parameters) and manually validate the discretionary elements through bar replay. Many traders find that defining their discretionary filters forces them to clarify what they are actually looking for, which improves both their backtesting and their live trading.
What is forward bias in backtesting?
Forward bias, also called look-ahead bias, occurs when the backtester uses information that would not have been available at the time of the trade. In manual backtesting, this happens when you see future price bars before committing to an entry, even unintentionally. A glance at the next few candles can confirm or deny your setup before you officially "take" the trade, inflating your win rate by 5 to 15 percent. Forward bias is the number one reason manual backtesting results do not match live trading performance. Automated backtesting eliminates forward bias structurally because the engine processes data sequentially and never displays future prices.
What is the best manual backtesting software?
The best manual backtesting software uses a true bar replay that hides future price action, so you cannot see what happens next and forward bias is minimized. Look for speed controls, all order types, automatic position sizing, and automatic logging of every replayed trade to a journal. TradeZella's bar replay offers 0.5x to 10x speed control, all order types, auto position sizing, drag-and-drop stop and target adjustment, ICT indicators, up to 5 symbols across 8 charts, an economic calendar, and RTH and ETH session filtering, and every trade you take saves to your journal automatically. That combination of realistic replay and automatic journaling makes it a strong choice for manual backtesting.
What is the best automated backtesting software?
The best automated backtesting software lets you test without writing code, shows every individual trade rather than only summary statistics, and runs on several years of historical data. TradeZella is the strongest choice for most traders because you write your rules in plain English, it runs them across more than 11 years of data on stocks, forex, futures, and crypto in minutes, every trade is visible with the setup drawn on the chart, and Zella AI analyzes the results. Coding platforms are powerful but require Pine Script, C#, or MQL5. If you want speed with no code, TradeZella is the better fit.
Can you do manual and automated backtesting in one tool?
Yes. TradeZella is one of the few platforms that does both in a single tool. You can run automated backtests by describing your rules in plain English, and you can manually backtest the same strategy with bar replay, stepping through historical charts and placing trades by hand. Both methods log every trade into the same journal and analytics dashboard, so you can validate a strategy statistically with automated testing and then practice executing it with manual replay, without switching platforms.
Can I use both manual and automated backtesting together?
Yes, and this is the recommended approach. Start with automated backtesting to generate a large sample (200 or more trades) and establish your statistical baseline: win rate, profit factor, expectancy, and maximum drawdown. Then manually replay 20 to 30 trades from the automated results to verify the entries were realistic and the fills were achievable. This combination gives you the statistical confidence of automated testing with the execution realism of manual validation. TradeZella supports both methods in one platform, so your automated results, manual replay trades, and live journal data all connect to the same analytics dashboard.
How does TradeZella handle backtesting?
TradeZella offers manual bar replay and has automated backtesting in one platform. For manual backtesting, the bar replay feature provides 0.5x to 10x speed control, all order types, auto position sizing, drag-and-drop stop loss and take profit adjustment, ICT indicators, up to 5 symbols across 8 charts, an economic calendar, and RTH/ETH session filtering. Every manually replayed trade automatically saves to your journal. For automated backtesting, you write rules in plain English or use pre-built templates for popular strategies, including ICT concepts, Opening Range Breakout, trend following, and mean reversion. The engine runs across years of historical data and generates every individual trade with full metrics. Zella AI, TradeZella's built-in AI trading partner, analyzes the results and identifies patterns and opportunities. Every individual trade is visible with full details, including entry, exit, P&L, and duration, which is what sets TradeZella apart from platforms that only show summary stats.