How to Build a Trade Journal That Actually Helps You Improve
How to Build a Trade Journal That Actually Helps You Improve
A step-by-step guide to building a trade journal that goes beyond logging trades. Covers the eight essential fields every entry needs, how to set up trade tags that produce actionable insights, and the three-tier review routine (daily, weekly, monthly) that turns journal data into measurable trading improvement.
class SampleComponent extends React.Component {
  // using the experimental public class field syntax below. We can also attach
  // the contextType to the current class
  static contextType = ColorContext;
  render() {
    return <Button color={this.color} />
  }
}
Last Updated: May 12th, 2026
A trade journal is a structured record of every trade you take, including the entry and exit prices, position size, profit or loss, the strategy that triggered the trade, and your emotional state during execution. Building an effective trade journal requires three components: a fast logging system (under five minutes per session), trade tags that categorize each entry by setup type and quality, and a review routine that converts raw data into specific, actionable changes. The most effective trade journals use automated broker import to eliminate manual data entry, custom tags to filter performance by strategy and behavior, and a three-tier review schedule (daily reflection, weekly analysis, monthly strategy assessment) to turn trading data into measurable improvement.
A trading journal only works if you actually use it. The reason most traders abandon their journal within two months is that they built it wrong from the start: too many fields, no clear structure, and no process for turning entries into insights.
The best trade journals share three traits. They are fast to update (under five minutes per session). They capture the data that drives decisions (not just prices and P&L). And they include a review system that forces you to learn from what you recorded.
This guide walks through exactly how to build a journal that meets all three criteria, whether you use a dedicated platform or start with a simple spreadsheet. If you are comparing journal options, the full breakdown of best trading journal software covers five platforms with pricing, features, and use cases side by side.
What Should You Track in a Trading Journal?
The eight essential fields every trade journal entry needs are: date and time, ticker or instrument, trade direction, entry price, exit price, position size, net P&L, setup type tag, and emotional state tag. These eight fields capture enough information to run every meaningful analysis (performance by strategy, performance by time of day, emotional impact on results) without creating the friction that causes traders to quit journaling.
The Eight Essential Fields
Date and time. When you entered and exited. This enables time-of-day analysis later, which is one of the most actionable reports you will ever run. After 50 trades, most day traders discover that 60 to 80 percent of their losses come from two or three specific hours. Without timestamps, that pattern stays invisible.
Ticker or instrument. What you traded. Over time, this reveals whether you perform better on certain stocks, pairs, or contracts. Futures traders should log the specific contract (ES, NQ, CL) since each has different tick values, margin requirements, and volatility profiles.
Direction. Long or short.
Entry price and exit price. The actual fill, not your planned level. The difference between planned entry and actual fill is slippage. Tracking actual fills lets you calculate real risk-reward ratio outcomes, not theoretical ones.
Position size. Number of shares, contracts, or lots. Combined with your entry and stop loss, this determines your dollar risk per trade. On a $50,000 account risking 1% ($500), your position size depends entirely on the distance between entry and stop. A Position Size Calculator runs this math in seconds.
Net P&L. Profit or loss after commissions. Always track net, not gross. A $200 gain that cost $40 in commissions is a $160 gain. Over 200 trades per year, ignoring commissions can overstate your results by $8,000 or more.
Setup type. What was the trade based on? VWAP bounce, breakout, gap fill, earnings play? This is the most important non-standard field because it lets you analyze your trading performance by strategy. In TradeZella, save each setup as a Strategy with defined entry rules. Every trade tagged to that Strategy feeds a dedicated performance report with win rate, profit factor, and trading expectancy calculated automatically.
Emotional state or quality tag. Was this a planned, high-quality entry? Or was it impulsive, driven by FOMO, or a revenge trade? Tagging this honestly is what separates useful journals from expensive diaries. The data from emotional tags is often the most valuable in the entire journal. Traders who track emotional trading patterns consistently find that their calm, planned trades outperform their impulsive trades by 30 to 50 percent in profit factor.
What Fields Should You Skip?
Dozens of technical indicators. You do not need to log RSI, MACD, Bollinger Band width, and ATR for every trade. If a specific indicator is central to your strategy, include it. Otherwise, more fields means more friction, and more friction means you will stop journaling.
Long narrative descriptions of every trade. A sentence or two about your reasoning is valuable. A 500-word essay about what the chart looked like is busywork that you will never re-read.
Screenshots of every chart. Useful occasionally for trades you want to study using trade replay. Not sustainable for every trade, every day.
The principle is simple: start lean and add fields only when your review process reveals a specific question you cannot answer with your current data. You can always add complexity later. You cannot get back the motivation you lose from a 15-minute logging process.
Which Journal Format Is Best for Your Trading Style?
The best journal format depends on your trading volume and willingness to do manual data entry. Spreadsheets work for traders taking fewer than five trades per day who are comfortable building their own analytics. Dedicated platforms like TradeZella work for any trading volume because automated broker import eliminates the data entry that causes most traders to quit. The detailed comparison of trading journal vs spreadsheet breaks down the specific volume levels where spreadsheets start to break down.
Option 1: Spreadsheet (Google Sheets or Excel)
Pros: Free, customizable, you control everything. The free trading journal template on the TradeZella tools page gives you a pre-built spreadsheet with the essential fields, basic formulas, and a structure you can start using immediately.
Cons: Manual data entry (the number one reason traders quit journaling), limited built-in analytics, no trade replay, and you have to build every formula yourself.
Spreadsheets work if you trade fewer than five trades per day and you are comfortable building pivot tables for analysis. They break down quickly at higher volumes or when you want time-of-day reports, per-setup comparisons, or drawdown management tracking.
Option 2: Dedicated Trading Journal (TradeZella)
Pros: Automated importing from 500+ brokers (no manual entry), 50+ built-in analytics reports, trade tagging, Strategies for setup tracking, and trade replay. The analytics include R-multiple tracking, time-of-day reports, Strategy comparison, Calendar view for daily P&L patterns, and a trading dashboard with seven different view modes (Dollars, Percentage, R-Multiple, Ticks, Pips, Points, Privacy).
Cons: Monthly cost, slight learning curve for the feature set.
The automation alone is the deciding factor for most traders. When your trades import automatically, you never fall behind on logging. That consistency is what makes the data useful.
Option 3: Notion or Paper
Notion templates and paper notebooks work for qualitative journaling (writing down your thoughts, plans, and reflections) but struggle with quantitative analysis. You cannot easily calculate profit factor by setup type in a Notion database, and paper journals do not calculate anything.
If you go this route, keep the qualitative journal separate from your trade log. Use it for pre-market planning and post-session reflection, but track the actual numbers somewhere that can do math.
Feature
Spreadsheet
TradeZella
Notion / Paper
Trade Logging
Manual entry
Auto-import (500+ brokers)
Manual entry
Time Per Session
10-20 minutes
2-5 minutes (tags only)
10-15 minutes
Setup / Strategy Tracking
Manual formulas
Built-in Strategy comparison
Not supported
Emotion / Quality Tags
Manual column
Custom tags + Tags report
Free-text only
Time-of-Day Analysis
Requires pivot tables
Day & Time report (built-in)
Not possible
Win Rate / Profit Factor
Build formulas yourself
50+ reports, auto-calculated
Not possible
Trade Replay
No
3 replay modes
No
Multi-Broker Support
Manual consolidation
500+ brokers, one dashboard
Manual consolidation
Pre-Market Planning
Separate tab / doc
Notebook (integrated)
Strong (primary use case)
Drawdown Tracking
Complex formulas required
Built-in + Prop Firm Sync
Not possible
Best For
<5 trades/day, DIY traders
Any volume, data-driven traders
Qualitative reflection only
Cost
Free
Paid plans
Free
How Should You Structure Your Trade Journal?
An effective trade journal has three sections that serve three different purposes: the pre-market plan (written before trading to anchor decisions to a strategy), the trade log (recorded during or after each session to capture what actually happened), and the post-session review (written at the end of each day to reflect on execution quality). This structure ensures the journal captures intent, action, and reflection in a single workflow.
Section 1: Pre-Market Plan (Write Before You Trade)
Every morning, before the market opens, write down answers to five questions:
What setups am I looking for today?
What is on my watchlist? (Specific tickers, specific levels.)
What is my maximum loss for the day?
Any news or events I need to be aware of?
How am I feeling? (Honest answer. Tired, anxious, confident, distracted.)
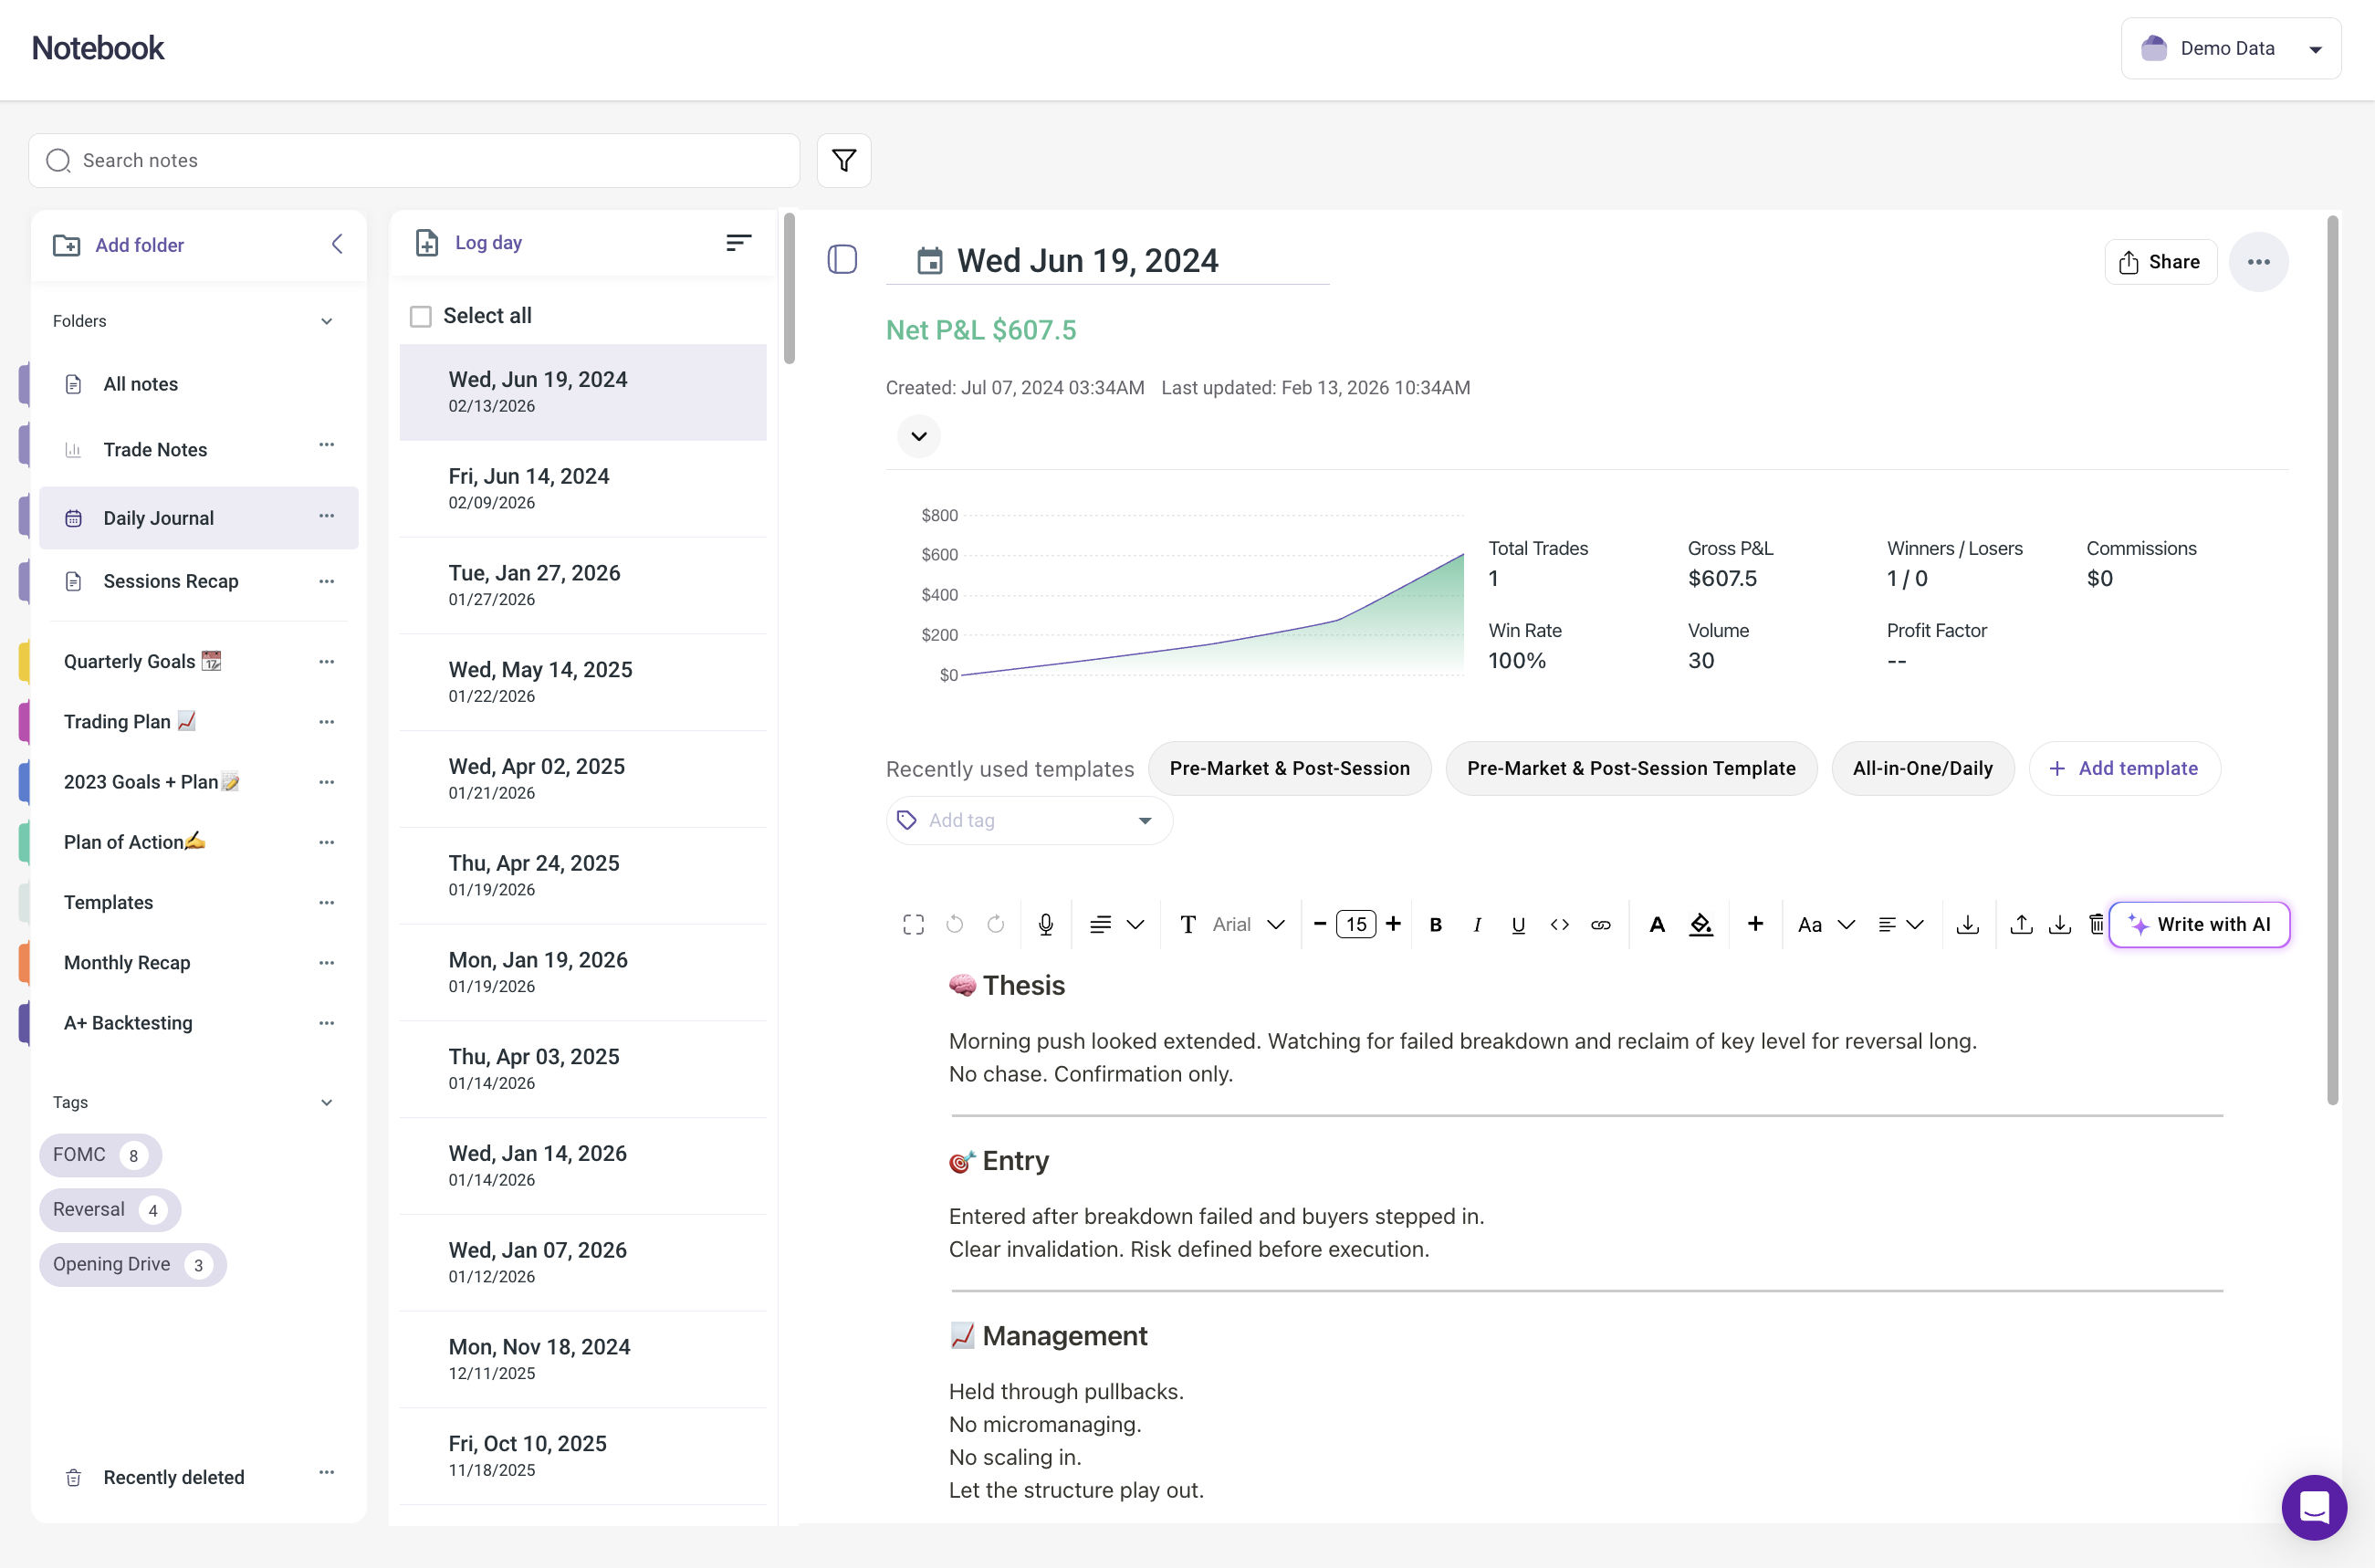
This takes three to five minutes and anchors your trading to a plan instead of to reactions. Your pre-market plan should align with your trading plan. The one-page plan defines your rules. The daily pre-market plan applies those rules to today's specific market conditions. In TradeZella, use the Notebook to write your daily plan where it lives alongside your trade data.
Section 2: Trade Log (Record During or After Your Session)
Each trade gets the eight essential fields: date and time, ticker, direction, entry price, exit price, position size, net P&L, setup tag, and quality or emotion tag.
If you are using a platform with automated importing, this section fills itself. You just add the tags and any brief notes. Even with automated import, spend 30 seconds per trade adding a setup tag and an emotion tag. Those two tags are what transform a trade log into an analytical tool. Without them, your journal is a ledger. With them, it is a feedback system.
Section 3: Post-Session Review (Write After You Are Done)
At the end of your trading day, write answers to four questions:
Did I follow my plan?
What did I do well?
What would I change?
Any trades that were clearly emotional?
Keep this to three to five sentences. The brevity matters. A quick, honest reflection you will do every day is infinitely more valuable than a detailed essay you will write once and never again. This daily reflection feeds directly into your trading discipline score. If you answered "no" to question one (did I follow my plan?), tag the specific rule you broke. After a month, your Rule Adherence Score shows exactly which rules you break most often and what those violations cost you in dollars.
How Do You Set Up Trade Tags That Produce Actionable Insights?
Trade tags are custom labels you assign to each trade that categorize it by strategy, quality, and emotional state. Tags are the mechanism that transforms a trade journal from a simple record of what happened into a filterable analytical tool. Without tags, your journal tells you that you made $500 this week. With tags, your journal tells you that your VWAP bounce trades made $1,200 while your breakout trades lost $700, that your calm entries have a 62% win rate while your FOMO entries have a 31% win rate, and that trades taken before 10:30 AM outperform afternoon trades by a factor of 3.4 in profit factor.
Starter Tag Framework
Setup tags: Label each trade by the strategy or pattern that triggered it. "VWAP bounce," "breakout," "gap and go," "pullback," "mean reversion." Use your own language. The names do not matter as long as you are consistent. If you have not defined your setups yet, start with three to five broad categories. You can split them into more specific tags after you have 50 trades and can see which categories need finer distinction. This is the first step in learning to find your trading edge.
Quality tags: Rate the trade quality. "A+ setup" (met all criteria perfectly), "B setup" (met most criteria), "C setup" (forced or marginal), "Off-plan" (did not match any defined strategy). Most traders find that their A+ trades have a profit factor above 2.0 while their C and Off-plan trades have a profit factor below 0.8. That single insight, stop taking C setups, often produces an immediate improvement in monthly P&L.
Emotion tags: "Patient entry," "FOMO trading," "Revenge trading," "Oversize," "Chased." These tags connect your journal to the psychology cascade. FOMO leads to revenge entries, revenge leads to oversizing, oversizing leads to daily limit breaches. Tag the first domino and you can trace the entire chain in your data.
Why Tags Matter for Performance Analysis
After 30 to 50 tagged trades, you can filter your performance data by any tag and see the stats for just that subset.
In TradeZella, the Tags report shows win rate, profit factor, total P&L, and average R-multiple for each tag in a side-by-side comparison. This is typically where traders find their first major insight. The process is the same one described in the trading habits guide: tag the behavior, accumulate 30 instances, compare the numbers, and let the data tell you what to keep and what to cut.
What to do: Create five to eight tags today. Commit to tagging every trade for the next month. The first month of consistent tagging produces more actionable data than a year of untagged trade logs.
What Review Routine Turns Journal Data Into Better Trades?
The journal is the input. The review is where the value gets extracted. An effective review routine has three tiers: a five-minute daily reflection, a 30-minute weekly analysis, and a 60-minute monthly assessment. Each tier serves a different purpose. The daily reflection captures context while it is fresh. The weekly analysis identifies patterns and selects one specific improvement. The monthly assessment evaluates strategy-level performance and sets direction for the next period.
Daily Review (5 Minutes)
At the end of each trading day: tag your trades, write your post-session reflection (three to five sentences), and note your emotional state. That is it. Do not try to analyze daily. Daily data is too noisy. On a $50,000 account, a single day might show a $400 loss that looks terrible. Over 20 trading days, that same account might be up $3,200. Daily data creates anxiety. Weekly and monthly data creates insight.
Weekly Review (30 Minutes, Every Sunday)
This is the backbone of your improvement process. Follow the structured weekly trade review process:
Look at your Calendar view for the week. Green days, red days, overall P&L.
Check performance by setup tag. Any Strategy trending better or worse than usual?
Check time-of-day performance. Did you trade outside your profitable hours?
Read your daily post-session notes. Any recurring themes?
Pick one thing to focus on improving next week. Just one.
The "one thing" rule is critical. When your review reveals three problems, the instinct is to fix all three. Resist it. Fix one, track it for two weeks, confirm the improvement, then move to the next. This is how the trading discipline score works: measure one behavior, improve it, then measure the next.
Monthly Review (60 Minutes, First Weekend of Each Month)
Zoom out. Look at the full month:
What were your best and worst performing Strategies? Filter by Strategy in TradeZella to see profit factor, win rate, and trading expectancy for each setup over the full month.
How did your expectancy trend over the month? Improving or declining?
What was your maximum drawdown, and what caused it? Cross-reference the worst drawdown days with your emotion tags. In most cases, the largest drawdowns correlate with revenge or tilt tags, not with strategy failure. Your drawdown management protocol should include specific actions at each drawdown tier.
Review your weekly "one thing" notes. Did you follow through on your adjustments?
Set one strategic goal for next month.
What to do: Block 30 minutes on your calendar every Sunday for the weekly review. Make it non-negotiable for four weeks. After a month of consistent reviews, you will have a clear picture of what is working and what needs to change. For the full analytics framework, read the guide on how to analyze your trading performance using five core metrics and five filtering dimensions.
What Are the Most Common Trade Journal Mistakes?
The five most common trade journal mistakes are: starting with too many fields (20+ per trade causes burnout within two weeks), only journaling on profitable days (bad days contain the most valuable data), logging without ever reviewing (a journal without a review process is just a filing cabinet), changing multiple variables at once (making it impossible to isolate what is working), and comparing your data to other traders instead of measuring your own progress over time.
Starting too complex. If your journal has 20 fields per trade, you will burn out in two weeks. Start with the eight essentials and add complexity only when you need it.
Only journaling on good days. Bad days teach you more than good days. If you skip journaling after losses, you are hiding from the data that would help you the most. On a $25,000 account, a trader who skips journaling on loss days misses an average of 40% of their trades. That means 40% of their data is invisible, and it is the 40% that would reveal the most about what needs to change.
Logging without reviewing. A journal you never look at is just a filing cabinet. The review process is where the value lives. Logging is just the prerequisite.
Changing everything at once. When your review reveals three problems, fix one at a time. Track the change for two weeks before introducing another. Otherwise you cannot tell what is working.
Comparing yourself to others. Your journal is your data, your patterns, your improvement path. Someone else's win rate or P&L is irrelevant to your analysis. Track your risk management metrics (max daily loss, position sizing adherence, stop loss discipline) month over month against your own baseline. That is the comparison that matters.
Key Takeaways
A good trade journal is fast (under five minutes per session), captures setup and emotion tags, and includes a review process that turns data into specific adjustments.
Track eight essential fields: date and time, ticker, direction, entry price, exit price, position size, net P&L, setup tag, and emotion tag. Skip everything that adds friction without adding insight.
Trade tagging is the highest-impact feature most traders overlook. Tags turn raw data into filtered, actionable insights. Create five to eight tags and commit to tagging every trade for 30 days.
Three-tier review routine: daily logging (5 minutes), weekly analysis (30 minutes on Sunday), monthly assessment (60 minutes). Each tier answers different questions at different time horizons.
Fix one thing per week based on your data. Small, data-driven adjustments compound over months into significant improvement.
Consistency beats complexity. A simple journal you maintain every day is worth more than a complex journal you abandon after two weeks.
Frequently Asked Questions
How long should I spend journaling each day?
Five to ten minutes per trading session is the effective range. With automated broker import, most of that time goes to tagging trades and writing a brief post-session reflection of three to five sentences. If journaling takes more than ten minutes, you are likely tracking too many fields. Reduce to the eight essentials and add fields only when your review process reveals a question your current data cannot answer.
What is the minimum number of trades before my journal data becomes useful?
Thirty trades gives you a reliable baseline for overall metrics like win rate and profit factor. For per-setup analysis, aim for 20 to 30 trades per setup type. Below those thresholds, the sample size is too small to distinguish real performance patterns from random variance. At 50 trades per setup, you can compare strategies with reasonable statistical confidence.
Should I journal paper trades and demo trades?
Yes. The habits and self-awareness you build from journaling carry over directly to live trading. Journaling paper trades also gives you a performance record of your strategy before you risk real capital. The only difference is that live trading adds emotional pressure, which makes the emotion tags even more important once you switch from demo to real money.
Is a spreadsheet good enough, or do I need dedicated journal software?
A spreadsheet works for traders taking fewer than five trades per day who are willing to do manual data entry and build their own analytics formulas. Most traders find that the manual entry becomes the primary reason they stop journaling after two to four weeks. Dedicated platforms automate the logging through broker import, which dramatically improves consistency. The right choice depends on your trading volume and your tolerance for data entry.
What if I trade on multiple accounts or brokers?
You need a journal that consolidates all accounts into one view. Trading on three platforms but only journaling one means your analysis is based on incomplete data. TradeZella connects to 500+ brokers and merges everything into a single dashboard, so your analytics reflect your total trading activity across all accounts.
How do I know if my journal is actually helping?
After 30 days of consistent journaling and weekly reviews, you should be able to answer three questions: which of your setups has the highest profit factor, what time of day produces your best results, and what percentage of your trades followed your rules. If you cannot answer those three questions, your journal needs better tags or a more structured review process. If you can answer them, the journal is working.
What is the most important thing to track in a trading journal?
Setup type tags combined with emotion tags provide the most actionable data. Setup tags reveal which strategies are profitable and which are not. Emotion tags reveal which behaviors are costing you money. Together, they answer the two questions that drive improvement: what should I trade more of, and what should I stop doing. Everything else in the journal supports these two categories of insight.