The Only Stock Trading Journal You Should Use in 2026
The Only Stock Trading Journal You Should Use in 2026
Stock trading creates unique journaling requirements that generic journals miss: sector rotation, earnings catalysts, and market cap behavior. This guide covers what to track, how to tag, and how to review stock trades so your journal actually improves your results.
class SampleComponent extends React.Component {
  // using the experimental public class field syntax below. We can also attach
  // the contextType to the current class
  static contextType = ColorContext;
  render() {
    return <Button color={this.color} />
  }
}
Last Updated: June 2, 2026
A stock trading journal is a structured record of every stock trade you take: the setup, entry and exit prices, position size, sector, catalyst, and your reasoning. TradeZella is an AI trading journal that handles most of this automatically. Your trades import from 500+ brokers the moment they close. Zella AI tags every trade by sector, catalyst, float, and setup quality based on rules you define. The Session Review agent journals your entire day. You can ask Zella AI any question about your stock data ("What is my win rate on technology breakouts this month?") and it answers with your actual numbers, with memory across every session. The journal exists, but it runs in the background. You trade. Zella AI handles the rest.
Most traders know they should keep a journal. Few do it consistently, and even fewer journal in a way that produces real insights. The problem is not laziness. It is that stock trading has requirements that generic journals miss. Stocks have sector rotation. They have earnings catalysts that create predictable volatility windows. They have pre-market gaps, after-hours moves, and float-driven behavior that changes how setups play out. A journal that does not capture these stock-specific variables cannot tell you whether your edge comes from small-cap momentum, large-cap mean reversion, or earnings breakouts.
This guide covers what to track, how Zella AI tags it for you, how to review your stock data, and how TradeZella's backtesting connects to your journal so you can validate setups before risking real money. If you already have a journal framework from our guide on how to build a trade journal, this article adds the stock-specific layer on top of it.
What Should a Stock Trading Journal Track?
A stock trading journal should capture eight fields for every trade. When you use TradeZella, most of these populate automatically from your broker connection. The ones that require your input (setup name, planned risk-reward, trade reason) take about 15 seconds per trade because you select from your pre-built Strategies instead of typing from scratch.
Here is what each field does for your analysis:
Entry and exit prices are the foundation. Without exact prices, you cannot calculate slippage, and slippage on stocks varies dramatically by float and volume. A low-float stock with 500,000 shares of daily volume may cost you $0.10 to $0.30 per share in slippage. A large-cap like AAPL may cost $0.01.
Position size in shares and dollars matters because stock position sizing depends on stop distance, which changes with volatility. A $50 stock with a $1 stop and a $200 stock with a $5 stop both represent the same percentage risk, but the share counts and dollar exposure are very different. Track both. Your Position Size Calculator handles the math, but your journal captures whether you followed it.
Dollar risk planned vs. dollar risk actual tells you whether you followed your sizing rules. On a $50,000 account risking 1% per trade, your planned risk is $500. If your actual loss was $750 because you moved your stop or added to a losing position, your journal flags the gap. This connects directly to your day trading risk management rules.
The setup name is what TradeZella calls a Strategy. Every trade should be tagged with the Strategy that triggered it: breakout, pullback, VWAP reclaim, opening range break, earnings gap. If you cannot name the setup, you should not be in the trade.
Planned risk-reward ratio captures your thesis before the trade. Were you targeting 2:1, 3:1, or just "hoping it goes up"? Trades without a planned ratio cannot be evaluated against your plan.
Actual result in R-multiples normalizes every trade regardless of share count. A trade that made $400 on $200 risk is +2R. A trade that lost $150 on $500 risk is -0.3R. R-multiples let you compare trades across different stocks and different position sizes.
One-sentence trade reason is the most underrated field. Write it before you enter. "TSLA reclaiming VWAP on heavy volume after gap down, targeting yesterday's close" is useful six months from now. "Looked good" is not.
What Stock-Specific Tags Should You Use?
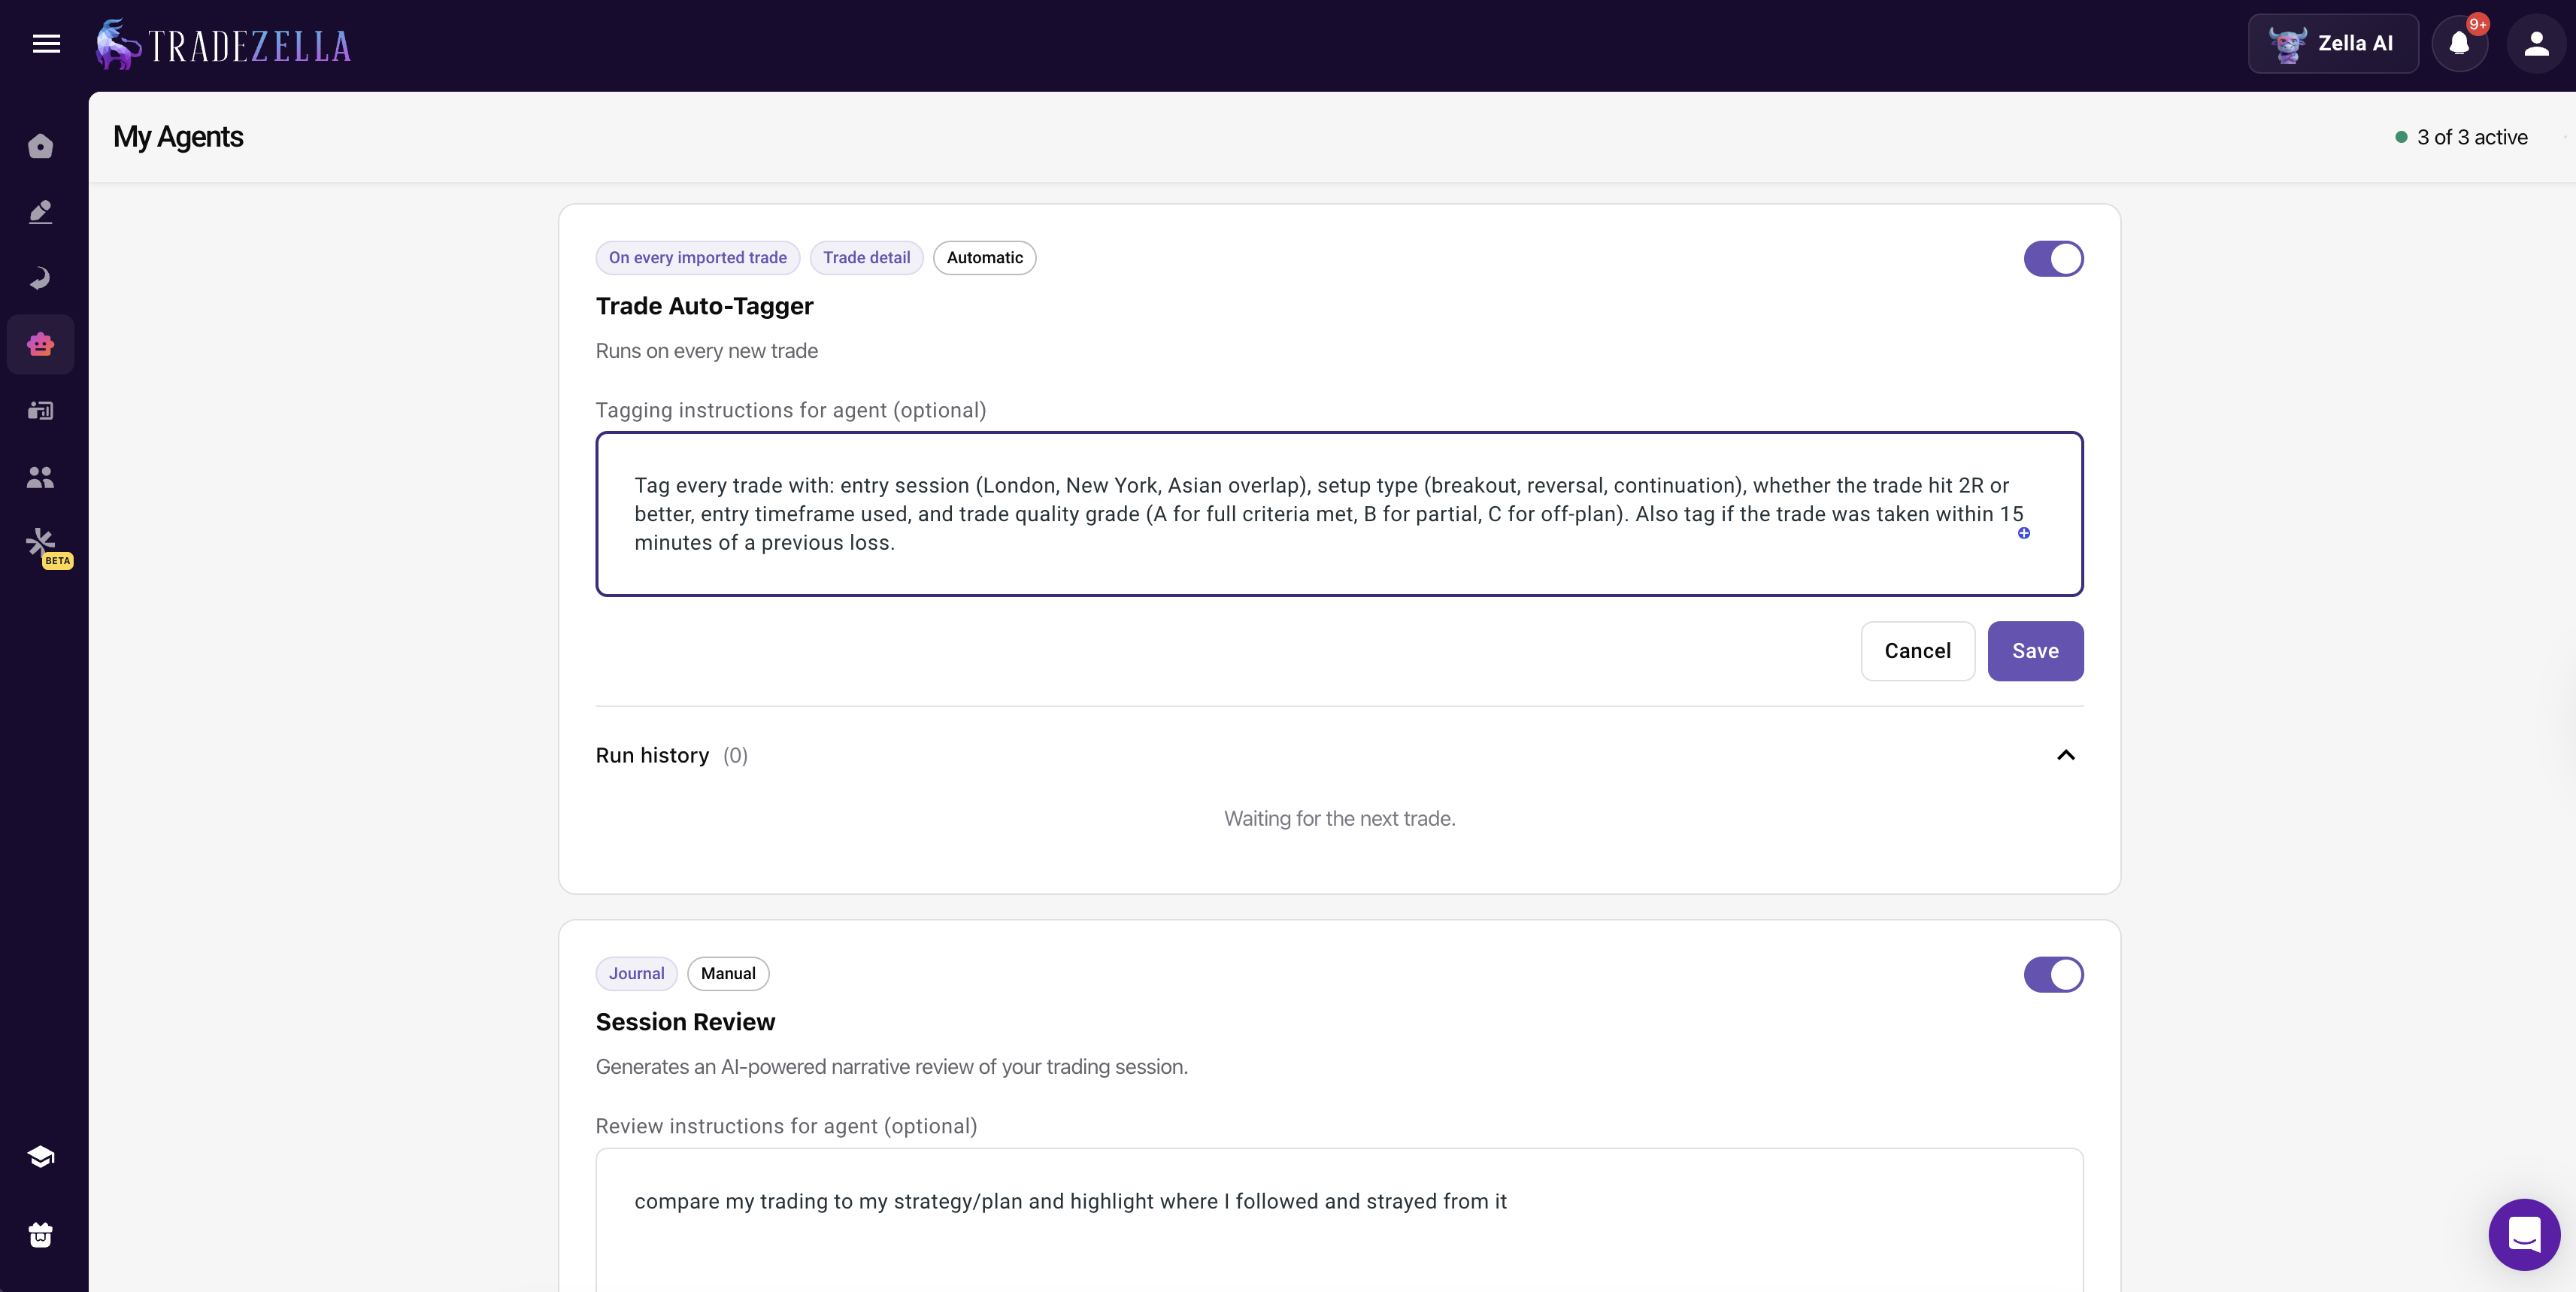
Stock trading needs five tag categories that other markets do not. In TradeZella, you do not apply these manually. You tell Zella AI's Auto Trade Tagger what to look for ("tag by sector," "tag by float," "tag by catalyst type," "tag trades above 2R"), and it applies them to every trade the moment it imports. No dropdowns. No checkboxes. No forgetting to tag after a bad day. These five tags, applied consistently by AI, let you filter your journal to find exactly where your edge lives.
Trade Auto Tagger
Sector Tags
Tag every stock trade with its sector: Technology, Healthcare, Energy, Financials, Consumer Discretionary, Industrials, Materials, Utilities, Real Estate, Communication Services, Consumer Staples. You do not need all eleven GICS sectors. Start with the five or six you trade most.
Why this matters: many traders discover they are consistently profitable in technology and healthcare but lose money in energy and financials. Without sector tags, that pattern is invisible. After 50 tagged trades, filter your journal by sector. If two sectors show negative expectancy, stop trading them.
Market Cap Tier
Tag each stock as large-cap (above $10B), mid-cap ($2B to $10B), small-cap ($300M to $2B), or micro-cap (below $300M). This matters because small-cap and micro-cap stocks behave differently: wider spreads, faster moves, more slippage, thinner order books. A setup that works on AAPL may fail completely on a $500M small-cap.
Dollar example on a $50,000 account: if your average win on large-caps is +1.8R but your average win on micro-caps is +3.2R with a lower win rate, the micro-cap strategy might still produce higher expectancy. You will not know without the tag.
Catalyst Type
Every stock trade happens for a reason. Tag the catalyst: earnings, FDA approval, analyst upgrade/downgrade, sector news, gap (connecting to the gap and go strategy), technical breakout, merger/acquisition, or no catalyst. Catalyst-driven trades and technical-only trades produce very different statistics, and mixing them in your analysis hides the signal.
Earnings season trades deserve special attention. The two weeks around quarterly earnings create predictable volatility for hundreds of stocks. Tag these separately so you can measure whether your earnings season performance justifies the extra risk.
Float Category
Tag stocks as low float (under 10M shares), medium float (10M to 50M), or high float (above 50M). Low-float stocks can move 20% to 50% in a session on relatively small volume. High-float stocks rarely move more than 5% without a major catalyst. Your stop placement, position size, and profit targets should all differ based on float, and your journal should track whether they actually do.
Setup Quality Grade
Grade every trade A, B, or C before you enter. An A-setup has the perfect trading pattern, volume confirmation, and a clear catalyst. A C-setup is marginal, maybe you are bored, maybe you see a "sort of" pattern. After 30 trades, filter by grade. If your A-setups have a profit factor of 2.5 and your C-setups have a profit factor of 0.8, the data just told you to stop taking C-setups.
Psychology Tags
Stock trading psychology has unique triggers. Tell Zella AI to tag trades as FOMO (chased a runner), revenge (took a trade after a loss to "make it back"), planned (followed your process), and off-plan (deviated from rules). The Auto Trade Tagger can identify some of these patterns automatically based on rules you define, for example, "tag as revenge if I took a trade within 5 minutes of a losing trade." These connect to the broader trading psychology framework but applied specifically to your stock trades. After a month of tagging, ask Zella AI: "How much did my off-plan trades cost me this month?" It answers with the exact dollar amount.
How Does TradeZella Import Your Stock Trades?
The fastest way to journal stock trades is automated import. TradeZella supports auto-sync with most major stock brokers, including Webull, Charles Schwab (Thinkorswim), Robinhood, and Interactive Brokers. You connect your broker account once, and every trade imports automatically, with entry price, exit price, position size, P&L, and timestamps already filled in.
Here is how the major stock brokers connect:
Webull: Auto-sync available for US accounts. Supports stocks and options. Trades sync same day.
Charles Schwab (Thinkorswim): API connection imports up to 60 days of historical data. Future trades import automatically on a daily basis.
Robinhood: Auto-sync available. Trades import same day.
Interactive Brokers: Auto-sync with daily import for past and future trades across all instrument types.
For brokers without direct API connections, TradeZella accepts CSV file uploads. Export your trade history from your broker, upload the file, and the data maps automatically. This takes about two minutes per import session.
The point of automated import is not convenience for its own sake. It is journal compliance. When you have to manually enter every trade, compliance drops below 40% after the first month. When trades import automatically, your journal is always complete.
But import is just the beginning. The moment your stock trades land in TradeZella, Zella AI takes over. The Auto Trade Tagger applies your tagging rules to every trade: sector, catalyst, float, setup quality, and any custom rules you defined. The Session Review agent compares your morning plan against what you actually traded and journals the entire session. By the time you close your charts, your trades are imported, tagged, reviewed, and journaled. You did not type a single field.
How Do You Review Stock Trades?
Because Zella AI tags and reviews your trades automatically, your weekly review becomes about reading the data instead of entering it. The Session Review agent already journals each day. Your tags are already applied. You sit down on Sunday, open your trading dashboard, and filter. A 30-minute weekly review catches problems that cost hundreds of dollars per month.
TradeZella Dashboard
Here is a weekly review workflow based on the trade review process framework, adapted for stock trading:
Step 1: Sector Performance (5 minutes)
Filter your trades by sector for the past week. Which sectors were profitable? Which lost money? On a $50,000 account with $500 risk per trade, discovering that your technology trades averaged +1.4R while your energy trades averaged -0.6R tells you exactly where to focus next week.
This connects to your broader trading dashboard where you can see performance breakdowns across every dimension.
Step 2: Setup Comparison (5 minutes)
Filter by Strategy. Compare your breakout trades against your pullback trades against your gap trades. Look at win rate, average win, average loss, and profit factor for each. After a month of data, you can start building a trading edge statement: "My VWAP reclaim setup in technology stocks before 10:30 AM has a 62% win rate and 2.1 profit factor."
Step 3: Time-of-Day Analysis (5 minutes)
Stock markets have clear session dynamics. The first 30 minutes after the open are the most volatile. The lunch hour (11:30 AM to 1:00 PM) is typically low volume. The last hour sees institutional positioning. Filter your trades by entry time. Many stock traders discover their best performance window is 9:30 to 10:30 AM and their worst is the lunch hour.
Review this alongside your P&L calendar to see daily patterns over time.
Step 4: Quality Grade Review (5 minutes)
Filter by your A/B/C setup quality grades. Calculate the expectancy for each grade. If A-setups produce +0.8R average and C-setups produce -0.3R average, your path to improvement is not learning new setups. It is taking fewer C-setups.
Step 5: Mistakes and Emotions (10 minutes)
Filter for trades tagged as off-plan, revenge, or FOMO. Calculate their total cost in dollars. On a $50,000 account, four off-plan trades per week at an average loss of -1.2R costs $2,400 per month. That number makes the abstract concept of discipline very concrete.
Use these trading journal tips to keep your review focused and under 30 minutes. The goal is consistent review, not exhaustive review.
What Are the Most Common Stock Journal Mistakes?
Most stock journal mistakes come from the same root cause: traders doing the work manually instead of letting AI handle it. Here are five mistakes and how TradeZella prevents each one.
Mistake 1: Not tracking sector. This is the single most valuable stock-specific tag. Without it, you cannot tell whether a losing month is a strategy problem or a sector problem. If your breakout strategy works in technology and fails in energy, the fix is sector selection, not a new strategy. In TradeZella, Zella AI's Auto Trade Tagger tags every trade by sector automatically. The pattern becomes visible the moment you filter.
Mistake 2: Not grading trade quality. An A-setup with perfect volume confirmation and a C-setup you took because you were bored should not be analyzed together. Tell Zella AI to tag each trade by quality grade, and after 50 trades, ask: "What is my profit factor on A-setups vs C-setups?" The answer usually ends the debate about whether discipline matters.
Mistake 3: Ignoring pre-market context. A stock that gapped up 8% on earnings has a completely different risk profile than one that opened flat. Tell the Auto Trade Tagger to tag by gap size and catalyst type. Now your journal captures pre-market context without you remembering to do it on every trade.
Mistake 4: Relying on memory instead of data. After 100 trades, you cannot accurately remember which setups worked. Memory is biased toward recent trades and dramatic outcomes. TradeZella's 50+ reports replace memory with data. Ask Zella AI which Strategy performed best last month and it answers instantly from your actual numbers.
Mistake 5: Skipping reviews. Monthly reviews catch problems 4 weeks too late. Zella AI's Session Review agent reviews every single day for you, whether you feel like it or not. Your weekly 30-minute review becomes reading the AI's work instead of doing it from scratch. Use these trading journal tips to keep the review focused.
For a deeper framework on the psychology behind these mistakes, see our emotional trading guide.
How Does Backtesting Connect to Your Stock Journal?
Your stock trading journal is not just a record of what happened. It is the dataset that tells you what to test next. TradeZella's backtesting engine connects directly to your journal, so the cycle from observation to validation to execution happens inside one platform.
Here is how the connection works for stock traders:
Journal data reveals the hypothesis. Your journal shows that VWAP reclaim trades in technology stocks before 10:30 AM have a 2.1 profit factor, while the same setup after 11:00 AM sits at 0.7. That is a hypothesis worth testing: does this pattern hold across a larger sample?
Backtesting validates it. Open TradeZella's backtesting with TradingView-powered charts, 11+ years of historical stock data, built-in ICT indicators, and all order types. Run your VWAP reclaim setup on historical data for 50+ trades. If the pattern holds, you have a validated trading edge. If it does not, you saved yourself months of trading a losing setup live. See our full guide on backtesting trading strategies or our step-by-step walkthrough on how to backtest with TradeZella.
Live results close the loop. After you trade the validated setup live, your broker-imported trades appear in the same analytics as your backtested trades. Filter by "Backtest" vs "Live" on the same Strategy and see whether your real execution matches the historical performance. The gap between backtest and live tells you exactly how much execution quality, emotions, and market conditions are costing you. No other backtesting software connects simulated results to live performance in the same analytics engine.
This journal-to-backtest-to-live loop is what separates traders who guess from traders who know.
Key Takeaways
Stock trading journals need five tags that other markets do not: sector, market cap tier, catalyst type, float category, and setup quality grade. In TradeZella, Zella AI's Auto Trade Tagger applies all five automatically based on rules you define.
TradeZella imports stock trades from 500+ brokers including Webull, Schwab, Robinhood, and Interactive Brokers. The moment your trades land, Zella AI tags them, the Session Review agent journals your day, and your data flows into 50+ analytics reports.
You can ask Zella AI any question about your stock data: "Which sector is costing me money?" "Am I profitable on earnings gaps?" It answers with your actual numbers, pushes back when your data says you are wrong, and remembers your preferences across every session.
TradeZella's backtesting connects directly to your journal. Your journal data reveals the hypothesis. Backtesting validates it on 11+ years of historical stock data. Live results close the loop. The gap between backtest and live tells you exactly what execution and emotions are costing you.
Weekly reviews take 30 minutes because the AI already did the tagging and session review. You read the data, filter by sector, setup, time of day, and quality grade, and make decisions based on what Zella AI surfaced.
Track eight fields per trade: entry price, exit price, position size, dollar risk, setup name (Strategy), planned risk-reward ratio, actual result in R-multiples, and a one-sentence trade reason. Then add stock-specific tags: sector, market cap tier, catalyst type, float category, and setup quality grade. In TradeZella, most fields populate automatically from your broker import, and Zella AI's Auto Trade Tagger handles the tags based on rules you define. You tell the AI what to tag and it applies those tags to every trade without manual work.
How does Zella AI work for stock traders?
Zella AI is TradeZella's built-in AI trading partner. For stock traders, the Auto Trade Tagger tags every trade by sector, catalyst, float, market cap, and setup quality automatically. The Session Review agent journals your entire trading day by comparing your morning plan against actual results. The Market Sentiment Briefing generates a personalized pre-market plan based on your instruments and trading style. You can ask Zella AI any question about your stock data and it answers with your actual numbers. It has memory across sessions, so every interaction makes the next one more useful.
Do I need a separate journal for stocks and options?
No. TradeZella imports both stocks and options from brokers like Webull, Schwab, and Interactive Brokers. Use separate Strategies to categorize stock trades and options trades, then filter by Strategy when you review. Zella AI tags both instrument types based on the rules you define. Everything stays in one platform while still letting you analyze each type independently.
How many stock trades do I need before my journal data is useful?
Your journal provides value from the first trade because Zella AI tags it and the Session Review agent documents your day. Pattern detection in the analytics becomes directionally accurate at 30 trades per setup. At 50 trades, your win rate and profit factor by Strategy are solid. At 100 or more trades, you can identify time-of-day patterns, sector concentration, and behavioral cascades with high confidence. Do not wait for 100 trades to start reviewing. Start weekly reviews after your first full week.
How does TradeZella's backtesting connect to stock journaling?
Your journal data reveals which setups work and which do not. TradeZella's backtesting lets you validate those patterns on 11 plus years of historical stock data with TradingView-powered charts and built-in ICT indicators before risking real money. After you trade the validated setup live, your broker-imported trades appear in the same analytics as your backtested trades. Filter by backtest vs live on the same Strategy and see whether your real execution matches the historical performance.
How does TradeZella import stock trades?
TradeZella offers two import methods: auto-sync and CSV file upload. Auto-sync connects directly to your broker API. Webull, Robinhood, Charles Schwab (Thinkorswim), and Interactive Brokers all support auto-sync, with trades importing same day. For brokers without direct API connections, you export a CSV and upload it. TradeZella supports 500 or more brokers total. The moment trades import, Zella AI takes over with automatic tagging and session review.
Should I journal pre-market and after-hours stock trades?
Yes. Pre-market and after-hours trades carry wider spreads, thinner liquidity, and different volatility profiles. Tell Zella AI's Auto Trade Tagger to tag trades by session (pre-market, regular hours, after-hours) and your journal automatically separates them. Many stock traders discover that their after-hours trades have significantly worse expectancy than regular session trades. Without the tag, that pattern stays hidden.