Trading Journal for Futures Traders: Track Every Contract, Find Your Edge
Trading Journal for Futures Traders: Track Every Contract, Find Your Edge
Futures traders make more decisions per session than almost anyone in the markets, and most of that data disappears the moment the chart closes. A journal built for futures captures what generic logs miss: tick values per contract, session timing, margin exposure, and the execution details that separate a breakeven month from a funded one.
class SampleComponent extends React.Component {
  // using the experimental public class field syntax below. We can also attach
  // the contextType to the current class
  static contextType = ColorContext;
  render() {
    return <Button color={this.color} />
  }
}
Last Updated: April 13th, 2026
A futures trading journal is a structured log that records every trade you take across futures contracts like ES, NQ, CL, and gold, capturing contract-specific details that generic trade logs miss. Unlike stock or forex journals, a futures journal tracks tick values, margin exposure, session timing, and contract size so your performance data reflects your actual dollar risk. Traders who journal their futures trades consistently identify which instruments, sessions, and setups produce real edge, and which ones quietly drain their accounts.
Futures trading moves fast. You're in and out of positions within minutes, managing contracts across ES, NQ, CL, or gold, and processing dozens of decisions per session. Without a journal built for this pace, you lose the data that actually matters: which setups work, which sessions bleed money, and whether your risk per contract stays consistent.
A futures trading journal isn't a generic trade log. It's a system that captures contract-specific details like tick value, margin requirements, and session timing so you can review your performance with precision. Traders who journal consistently identify their profitable setups faster and cut their losing patterns sooner. The difference between a breakeven futures trader and a profitable one often comes down to whether they track and review their data.
This guide covers what to log in a futures trading journal, how to structure your review process, and what to look for when your P&L isn't matching your effort.
Why Do Futures Traders Need a Specialized Journal?
Generic journals treat every trade the same. But futures trading has unique characteristics that demand specific tracking:
Contract specifications vary wildly. One ES contract has a $50/point tick value. One MNQ micro contract moves at $2/point. That means a 10-point move on ES is $500, while the same move on MNQ is $20. If your journal doesn't account for contract type and size, your P&L analysis is meaningless. You need to compare apples to apples when reviewing performance across different instruments. The Futures Calculator on our tools page shows exact tick values, margin requirements, and dollar-per-point for every major contract.
Contract
Tick Value
$/Point
Why Journal Tracking Matters
Common Journal Mistake
ES (E-mini S&P 500)
$12.50/tick
$50/point
A 10-point stop on 2 contracts = $1,000 risk. Need per-contract P&L to size correctly.
Logging points gained without converting to dollars
NQ (E-mini Nasdaq)
$5.00/tick
$20/point
Higher volatility means wider stops. Session timing analysis is critical for NQ.
Comparing NQ point moves to ES without adjusting for volatility
CL (Crude Oil)
$10.00/tick
$1,000/point
Extreme dollar-per-point. A 0.50 move = $500. Risk per trade must be tracked precisely.
Not tagging inventory report trades separately from normal setups
GC (Gold)
$10.00/tick
$100/point
Trades across London, NY, and Asian sessions. Time-of-day tags reveal session edge.
Ignoring overnight session trades in weekly reviews
MES (Micro E-mini S&P)
$1.25/tick
$5/point
Lower risk per contract. Ideal for testing new setups live while journaling results.
Mixing MES and ES stats without adjusting for contract size
MNQ (Micro E-mini Nasdaq)
$0.50/tick
$2/point
Smallest dollar risk per contract. Journal should still track full execution quality.
Treating micro trades as "practice" and skipping journal entries
RTY (E-mini Russell 2000)
$5.00/tick
$50/point
Lower liquidity = more slippage. Track planned vs actual entry price for every trade.
Not accounting for slippage when calculating true P&L
Session timing matters more than in equities. Futures markets run nearly 24 hours. The overnight session, the open, and the afternoon session each behave differently. A setup that prints money during the 9:30-10:30 AM window might be a consistent loser during the London session overlap. Your journal needs to capture entry timestamps with enough precision to run time-of-day analysis.
Margin and leverage amplify mistakes. Futures traders often use significant leverage. On a $50,000 account trading 2 ES contracts, a 20-point adverse move is $2,000, or 4% of your account, in a single trade. That same percentage move on a stock position might take days to develop. A position sizing error that costs a stock trader 1% of their account can cost a futures trader 5% in the same timeframe. Tracking your actual risk per trade (not just your intended risk) reveals whether you're sizing consistently.
What Should You Track in Every Futures Trade?
The fields you log determine the questions you can answer later. A journal with only entry, exit, and P&L tells you what happened. A journal with setup tags, session data, execution ratings, and mental state tells you why it happened.
At minimum, your futures journal should capture these data points for each trade:
The basics: instrument (ES, NQ, CL, etc.), contract size, entry price, exit price, entry time, exit time, direction (long/short), and realized P&L. Make sure your journal calculates P&L using the correct tick value per contract. Two MES contracts at $5/point and one ES contract at $50/point produce very different dollar results from the same price move.
The context: which setup triggered the entry (breakout, mean reversion, order flow signal), the session (pre-market, regular hours, overnight), and the market conditions (trending, range-bound, high volatility event like FOMC). Tagging context turns your journal into a filterable database. After 100 trades, you can pull up every FOMC trade you've taken and see whether event-driven trading actually works for you.
The execution quality: did you enter at your planned price or chase? Did you honor your stop or move it? Did you take the full target or cut early? Rate your execution on a 1-5 scale. This is one of the most underused fields in any journal. A trade can hit your target and still be a bad execution if you moved your stop twice and added size on a pullback. Tracking execution quality separately from P&L reveals whether your results are repeatable or lucky.
The mental state: were you calm and focused, or were you trading after a loss and trying to recover? A simple tag like "A-game" vs "tilted" vs "FOMO entry" creates a dataset you can analyze later.
After 50+ trades, filtering by these tags reveals patterns you can't see in the moment. You might discover that your execution quality drops after 11 AM, that your "tilted" trades have a 22% win rate versus 61% for your planned entries, or that your mean reversion setups have twice the expectancy of your breakout trades. These aren't guesses. They're data points your journal surfaces automatically once you tag consistently.
How Should You Review Your Futures Trades?
Logging trades is step one. The review is where the edge lives. Without a structured review cadence, your journal is just a database collecting dust. The traders who improve fastest are the ones who look at their data on a consistent schedule, not the ones who log the most fields.
Daily Review (5 Minutes at Session Close)
Tag each trade with its setup type and your mental state. Write one sentence about the best and worst decisions you made. This takes almost no effort if your journal auto-imports from your broker.
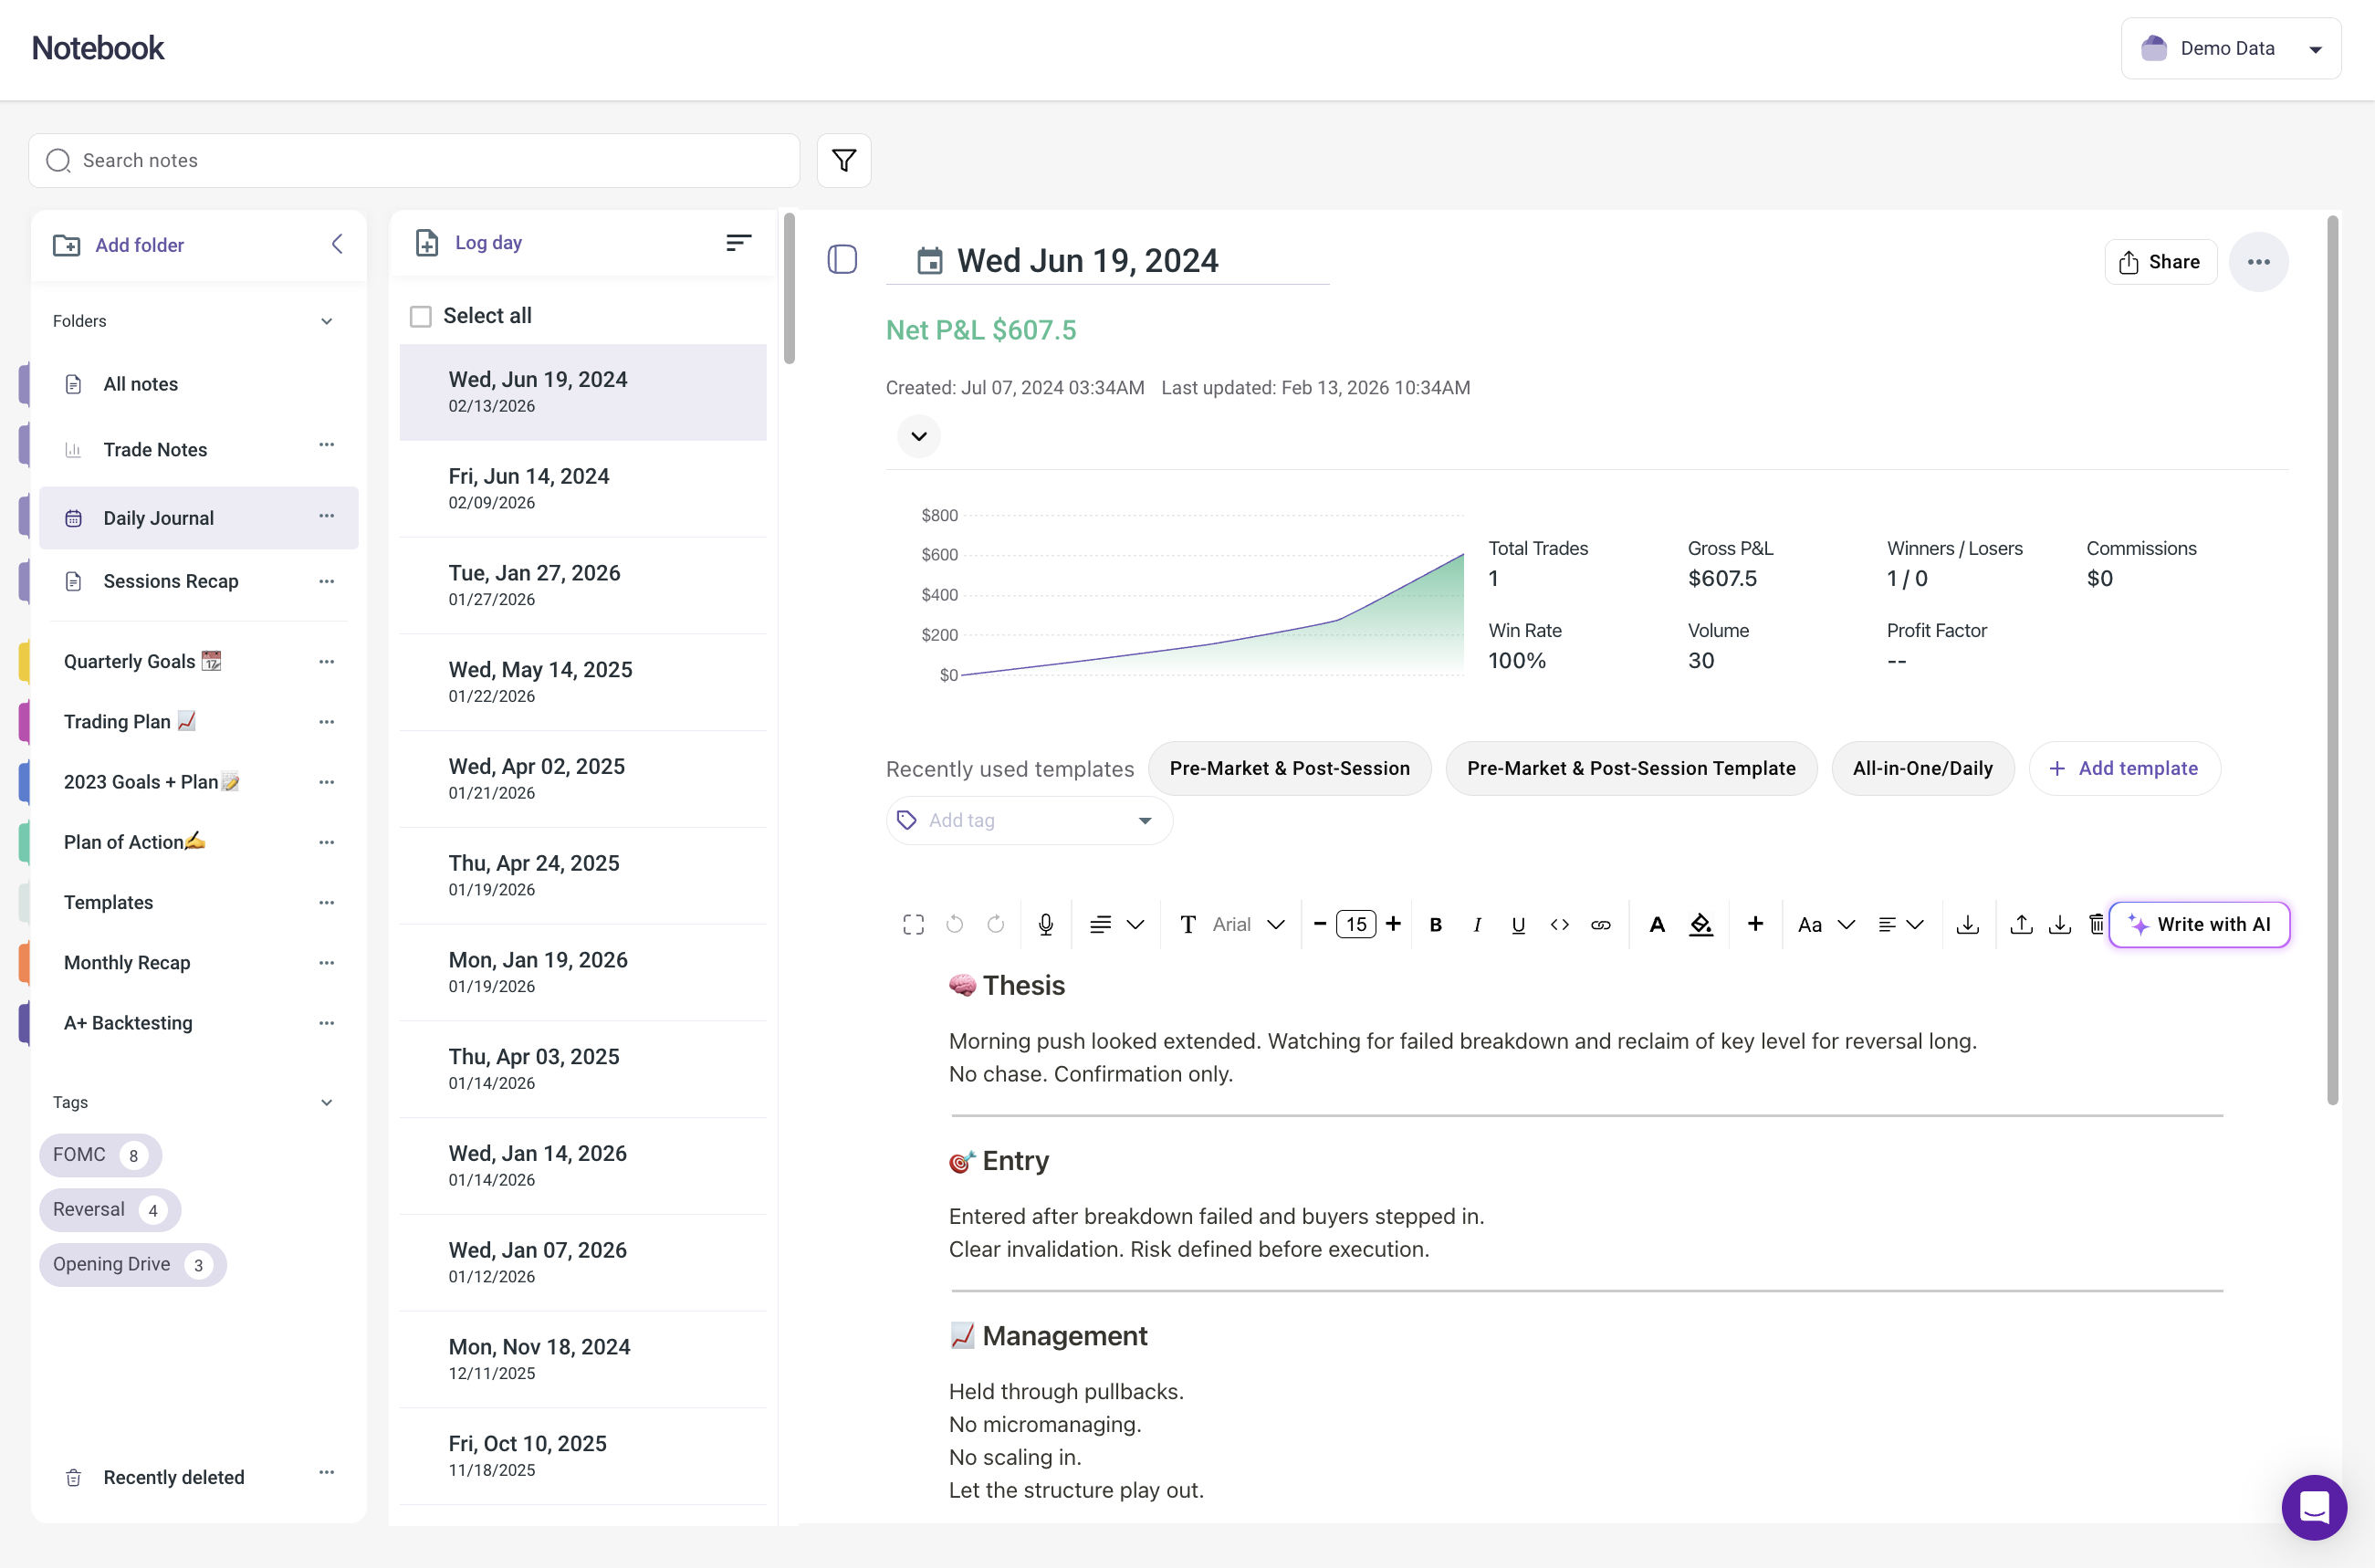
Journal NoteBook Screenshot
Weekly Review (30 Minutes on Sunday)
Pull up your calendar view to see daily P&L at a glance. Look for patterns: are your losing days clustered around specific sessions or instruments? Check your performance by setup type. If your mean reversion setups are losing money on ES but producing a 2.3 profit factor on NQ, that's actionable data. It doesn't mean the setup is broken. It means ES and NQ have different intraday characteristics, and your setup fits one better than the other.
Monthly Review (60 Minutes on the First of the Month)
This is the big picture check. Look at your overall stats: win rate, profit factor, average R-multiple, max drawdown. Compare these to the previous month. Are you improving? Then drill into your Strategies performance. After a full month, you'll have enough data to decide whether to keep, modify, or drop specific setups.
The monthly review is also where you check your drawdown management. Futures leverage means drawdowns develop faster than in stocks. If your maximum drawdown this month was 6% and your threshold is 5%, that's a red flag worth investigating before next month starts.
TradeZella Dashboard showing monthly performance
How Do You Track Multiple Futures Instruments?
Most futures traders don't trade a single contract. You might trade ES during the morning session, switch to CL during the oil inventory report, and take a shot at NQ in the afternoon. Each instrument has different tick values, different volatility profiles, and different optimal setups.
Your journal should let you filter performance by instrument so you can see your true edge on each one. Here's what that looks like in practice: say you've taken 200 trades over two months. Your blended stats show a 52% win rate and a 1.4 profit factor. Decent, but not great. When you break it down by instrument, the picture changes completely.
Your CL trades have a 40% win rate and a 0.85 profit factor, meaning you're a net loser on crude oil. Your ES trades run at 58% with a 2.1 profit factor. Your NQ scalps sit at 49% win rate but a 1.8 profit factor because your winners are significantly larger than your losers. The blended number was hiding a serious leak in CL and a real edge in ES. Without instrument-level filtering, you'd never see it.
What to do: At the end of each month, rank your instruments by profit factor. If any instrument has been negative for two consecutive months, either refine your approach or stop trading it until you've backtested a new strategy.
How Does Futures Leverage Affect Your Trading Psychology?
Futures leverage compresses the emotional cycle. A stock trader who risks 1% per trade might take weeks to hit a 5% drawdown. A futures trader can get there in a single bad session. That compression creates psychological pressure that doesn't show up in backtests but absolutely shows up in your journal data.
Three patterns to watch for in your futures journal:
Revenge trading after a fast loss. You lose $800 on a 2-lot ES trade in 4 minutes. The urge to make it back immediately is stronger than in any other market because the loss happened so fast. Your journal should tag these "recovery attempt" trades separately. If your revenge trades have a win rate below 35%, you have data to build a rule: after a loss exceeding $500, wait 15 minutes before the next entry.
Session fatigue and overtrading. Futures markets are open nearly around the clock, and the temptation to keep trading through slow sessions is real. Your journal's time-of-day analysis will show exactly when your edge disappears. Many futures traders discover that their P&L goes negative after 2-3 hours of screen time, regardless of what the market is doing. That's fatigue, not bad setups.
Size creep on "easy" days. Your first two trades hit target. You feel confident, so you bump from 2 contracts to 4. The third trade goes against you and wipes out both winners. Your journal's position size field catches this pattern. When you review and see that your average losing trade is 1.5x the size of your average winner, that's not a strategy problem. That's a position sizing discipline problem.
What Should You Look for in a Futures Trading Journal?
Not every journal handles futures well. Many are built for stocks first and treat futures as an afterthought. Here's what separates a journal that works for futures traders from one that just logs trades.
Automated import from your broker. If you're trading on NinjaTrader, Tradovate, or Interactive Brokers, the journal should pull your trades automatically. Manual entry for 30+ trades a day is unsustainable. Even 10 minutes of manual entry after a 50-trade session adds up to hours per month. That's time better spent on your review process.
Contract-aware analytics. The journal should understand futures contract specs. When you trade 2 MES contracts versus 1 ES contract, the analytics should reflect the actual dollar risk, not just the number of contracts. A journal that shows "2 contracts, +10 points" without converting to dollars is useless for cross-instrument comparison.
Time-of-day analysis. Since futures sessions span different time zones and market conditions, you need performance breakdowns by hour to find your optimal trading window. This single feature often reveals the biggest edge improvement for futures traders. If you're profitable from 9:30-11:00 AM and breakeven the rest of the day, that's a clear signal to tighten your session window.
Multi-account support. If you trade futures across multiple brokers or prop firm accounts, combining everything into one dashboard saves hours of manual reconciliation.
Strategies tracking. You should be able to define each of your setups as a Strategy with specific entry criteria, then track performance per Strategy. This is how you identify which setups actually make money. In TradeZella, each Strategy includes entry rules, target and stop parameters, and tracks R-multiples automatically so you can compare setups on a risk-adjusted basis.
How Do Spreadsheets Compare to Dedicated Futures Journals?
A spreadsheet can technically track futures trades. But "technically" and "sustainably" are different things. Futures traders face a volume problem that stock traders don't: 10-30+ trades per session, each needing contract-specific calculations.
In a spreadsheet, you'd need formulas to convert ticks to dollars for each contract type, separate sheets for session analysis, manual pivot tables for instrument breakdowns, and custom formatting for time-of-day performance. After a 40-trade day, you're spending 20 minutes on data entry instead of 20 minutes reviewing your trades. The journal that takes zero effort to populate is the one you'll actually use 60 days from now. If you're weighing your options, the journal versus spreadsheet comparison breaks down exactly where spreadsheets stop scaling.
If you want to test the habit before committing to a tool, start with the free trading journal template to build the routine. Once you're logging consistently and want automated import and analytics, upgrade to a platform that handles the math for you.
How Do You Connect Journal Data to Your Backtesting Results?
Your journal and your backtesting process should feed each other. A backtest tells you what a strategy should do. Your journal tells you what it actually did when you traded it live.
Here's how to close the loop: after backtesting a futures setup (say, a mean reversion play on NQ during the first hour), your backtest might show a 55% win rate, 1.7 profit factor, and $150 average win over 300 historical trades. After trading it live for 60 days and logging every trade, pull up your journal stats for that specific Strategy.
If your live numbers are close to the backtest (within 10-15%), you're executing the strategy as designed. If your live win rate is 43% instead of 55%, something is off. Common causes: chasing entries instead of waiting for the exact trigger, widening stops mid-trade, or cutting winners early. Your journal's execution quality ratings and habit tags will point to which one.
What Mistakes Do Futures Traders Make With Journaling?
Tracking P&L but not risk. Knowing you made $500 today means nothing without knowing how much you risked to make it. If you risked $2,000 to make $500, your risk-adjusted return is poor even though the day was green. Track your planned risk and actual risk for every trade.
Ignoring the overnight session. If you trade globex hours, those trades need the same level of detail as your regular session entries. Many traders slack on journaling overnight trades and miss important patterns. Overnight sessions often have wider spreads and thinner order books, which means your execution quality data matters even more.
Not separating instruments in reviews. Reviewing "my futures trades" as one blob hides instrument-specific edges and weaknesses. Always break it down. A blended 50% win rate could be hiding a 65% winner on ES and a 30% loser on CL. You won't know until you filter.
Journaling for a week, then stopping. Consistency matters more than depth. A simple tag and one-sentence note on every trade for 60 days beats detailed paragraphs for 5 days followed by silence. The habit tracking approach works here: set a daily streak and protect it. The data compounds over time. Your journal at trade 200 is exponentially more useful than your journal at trade 20.
Skipping the review entirely. Some traders log religiously but never sit down to analyze. The journal isn't the edge. The review is. If you're logging 30 trades a day but never looking at your weekly instrument breakdown or session performance, you're building a database nobody reads.
How Does a Futures Journal Work for Prop Firm Traders?
Many futures traders are also prop firm traders, often managing multiple funded accounts simultaneously. If you're trading ES on FTMO, NQ on Topstep, and CL on Apex, each account has its own drawdown rules, profit targets, and risk limits. Your futures journal should consolidate all accounts into one view while still tracking per-account compliance. A winning trade on your Topstep account means nothing if a correlated losing trade on your FTMO account breaches your daily drawdown limit.
You can use TradeZella's Prop Firm Sync to connect your Prop Firm accounts and pull all your trades into one journal. From there, your analytics track performance per account, so you can see which firm you're profitable on, which one is costing you, and whether you're getting close to any drawdown limits. The prop firm trading journal guide covers multi-account tracking in more detail, including how to monitor aggregate exposure across firms.
Futures trading demands a specialized journal that tracks contract specifications, session timing, and instrument-specific performance.
Log entry/exit prices, contract size, setup type, session, execution quality, and mental state for every trade.
Run daily (5-min), weekly (30-min), and monthly (60-min) reviews to find patterns in your data.
Filter performance by instrument to identify which contracts you actually have an edge on.
Choose a journal with automated broker import, contract-aware analytics, and time-of-day breakdowns.
Track actual risk per trade, not just P&L. Futures leverage makes position sizing errors expensive.
Compare live journal data against backtest results to verify you're executing your strategy as designed.
Watch for futures-specific psychology traps: revenge trading after fast losses, session fatigue, and size creep on winning days.
Frequently Asked Questions
What should I track in a futures trading journal?
Track the instrument, contract size, entry and exit prices, timestamps, setup type, session (overnight versus regular hours), execution quality rating, and your mental state for every trade. After collecting 50 or more trades, filter by these fields to find performance patterns. The most valuable insight for futures traders is usually which instrument and session combination produces the best results.
Can I use a spreadsheet as a futures trading journal?
You can use a spreadsheet, but it becomes unsustainable quickly. Futures traders often take 10 to 30 trades per day, and manual entry eats into review time. Spreadsheets also cannot auto-calculate contract-specific metrics like dollar-per-point conversions or generate time-of-day analysis without significant formula work. A dedicated journal with automated broker import saves hours per week and ensures every trade gets logged.
How often should I review my futures trades?
Daily reviews should take about five minutes at session close. Tag each trade with its setup type and write one sentence about your best and worst decision. Weekly reviews of 30 minutes on Sunday focus on patterns across sessions and instruments. Monthly reviews of 60 minutes cover big-picture stats like win rate, profit factor, and maximum drawdown, along with Strategy-level performance. Consistency matters more than the length of each review.
What is the best trading journal for futures?
Look for a journal that supports automated import from futures brokers like NinjaTrader, Tradovate, and Interactive Brokers. The journal should understand contract specifications and convert tick movements to dollar amounts automatically. Time-of-day analysis, multi-account support for traders using multiple brokers or prop firms, and the ability to track performance by individual Strategy are essential features for serious futures traders.
Why do futures traders need a specialized journal instead of a generic one?
Futures contracts have unique characteristics that generic journals do not handle well. Each contract has a different tick value and dollar-per-point calculation. One point on an E-mini S&P 500 contract is worth $50, while one point on an E-mini Nasdaq contract is worth $20. Futures markets also run nearly 24 hours, making session timing analysis critical. A specialized journal tracks these contract-specific details and provides instrument-level performance breakdowns that generic logs cannot offer.
How do I track multiple futures instruments in one journal?
Your journal should let you filter performance by individual instrument so you can see your true edge on each one. At the end of each month, rank your instruments by profit factor. If any instrument has been negative for two consecutive months, either refine your approach or stop trading it until you have backtested a new strategy. Without instrument-level filtering, your blended statistics hide which contracts make money and which ones lose it.
How does futures leverage affect trading psychology and journaling?
Futures leverage compresses the emotional cycle because large dollar losses can happen in minutes rather than days. This creates three common patterns to track in your journal. First, revenge trading after fast losses, where you try to recover immediately after a large loss. Second, session fatigue and overtrading during slow market periods. Third, size creep on winning days where you increase position size after early wins and then give back profits. Tagging these patterns in your journal creates data you can use to build specific rules, like waiting 15 minutes after a loss exceeding $500 before taking the next trade.


.png)
.png)
.png)

