What to Write in a Trading Journal: The Per-Trade Checklist That Builds Your Edge
What to Write in a Trading Journal: The Per-Trade Checklist That Builds Your Edge
Most traders either write too much and quit, or write too little and learn nothing. This guide covers the 8 specific data points to capture after every trade, plus the tags and notes that turn your journal into an edge discovery engine.
class SampleComponent extends React.Component {
  // using the experimental public class field syntax below. We can also attach
  // the contextType to the current class
  static contextType = ColorContext;
  render() {
    return <Button color={this.color} />
  }
}
Last Updated: August 28, 2026
A trading journal entry is the record you create after each trade that captures both the factual data (price, size, result) and the decision-making context (why you entered, whether you followed your rules, and what you learned). The factual data tells you what happened. The context tells you why it happened. Without both, a journal is just a trade log.
Most traders fall into one of two traps. They either write too much, creating 500-word essays after every trade until they burn out by week three. Or they write too little, logging only entry, exit, and P&L, which gives them nothing useful to review later. The solution is a repeatable per-trade checklist: specific enough to surface patterns, simple enough to complete in under five minutes.
Every journal entry needs two layers of data. The first layer is mechanical: entry price, exit price, position size, direction, stop loss, take profit, fees, date, time, and result. This data describes the trade itself. In TradeZella, this entire layer is handled automatically through broker import from 500+ platforms, so you never have to type a number.
TradeZella Broker Import
The second layer is contextual: the decisions you made, the conditions you traded in, and the quality of your execution. This is where 90% of the improvement signal lives, and it is the layer that only you can provide. Auto-import handles the boring part so you can focus your five minutes on the part that actually builds your edge.
What Should You Write After Every Trade?
These are the 8 data points to capture after every trade. You do not need paragraphs. Most of these are a single word, a tag, or one sentence.
1. Strategy Name
Name the setup you traded. Not "long" or "short." The specific pattern: Bull Flag, VWAP Bounce, FVG Reclaim, Opening Range Breakout, EMA Pullback. In TradeZella, you assign each trade to a Strategy (formerly called Playbooks). This is the single most important field in your journal because it lets you compare performance across setups.
Without a Strategy name, all your trades blend into one average. With it, you can see that your Bull Flags run at a 2.1 profit factor while your VWAP Fades sit at 0.8. That distinction is the difference between knowing what to trade more of and guessing.
2. Quality Grade
Rate the trade A, B, or C based on how clean the setup was, not on the result.
A = textbook setup, met every criterion on your checklist. B = valid setup, one or two minor conditions missing. C = marginal setup, entered anyway.
This grade separates execution quality from outcome. An A-grade trade that loses money is still an A-grade trade. A C-grade trade that makes money is still a C-grade trade. Over 50 trades, you should find that A-grade setups have a meaningfully higher expectancy than C-grade setups. If they do not, your entry criteria need tightening.
3. Did You Follow Your Rules?
Binary answer: yes or no. For entry, trade management, and exit separately if you want the full picture.
This single data point drives your Rule Adherence Score, which is the most direct measurement of trading discipline. When you filter your journal by "Rules Followed" vs "Rules Broken," you often discover that your system is better than you thought. The damage comes from execution mistakes, not from bad setups.
Tag this with a simple custom tag in TradeZella: "Rules Followed" or "Rules Broken." After 30 trades, filter by that tag and compare the profit factor of each group. The gap is usually eye-opening.
4. Planned Risk vs Actual Risk
Write down the dollar amount you planned to risk and the dollar amount you actually risked. On a $50,000 account with a 1% rule, your planned risk is $500. If your stop got hit after you moved it further away, your actual risk might have been $750. If you added to a losing position, it might have been $1,000.
This gap between planned and actual risk is one of the most expensive patterns in trading. Over 100 trades, even a $100 average gap costs $10,000 per year. The only way to see it is to track it. For more on keeping risk consistent, see our guides on risk per trade and risk-reward ratio. If this gap keeps appearing, you may be making one of the common position sizing mistakes.
5. Trade Reason (Why You Entered)
One sentence explaining why you took the trade. Not a chart analysis essay. Just the core logic.
Examples: "ES broke above opening range with volume above average." "AAPL pulled back to VWAP with bullish FVG on 15M." "NQ swept prior day low, bullish CHoCH on 5M."
The reason matters because it tells future-you what you were thinking. After 50 trades, you can scan your reasons and spot when your entries are sloppy ("it looked like it was going up") vs precise ("bull flag on 5M above VWAP, A-grade quality"). Sloppy reasons correlate with lower win rates. This connects directly to your trading plan, which defines what a valid reason looks like.
6. Exit Reason (Why You Closed)
One sentence explaining why you exited. "Hit 2R target." "Stopped out at planned level." "Cut early because I felt anxious." "Moved stop to breakeven, got shaken out."
Exit reasons reveal the patterns that cost you the most money. If half your exits say "cut early," you have a profit-taking problem. If they say "moved stop further," you have a stop loss discipline problem. If they say "held through my target hoping for more," you have a greed problem. You cannot fix what you do not name.
7. Emotion Tag
Tag the dominant emotion during the trade. Not a diary entry. A single word: Confident, Anxious, Frustrated, Calm, Rushed, Revenge, FOMO, Bored.
In TradeZella, create a custom tag category called "Emotion" with 6-8 options. After 50 trades, filter by emotion tag and compare results. Most traders find that "Calm" and "Confident" trades produce meaningfully better results than "Rushed," "Revenge," or "FOMO" trades.
This is where psychology becomes measurable instead of theoretical. Instead of reading about revenge trading or FOMO trading in the abstract, you see exactly how many revenge trades you took, what they cost, and which conditions triggered them. For deeper frameworks on emotional patterns, see our guides on trading tilt and emotional trading.
8. One Lesson
One sentence. What did this trade teach you? Not every trade has a lesson, and that is fine. Write "clean execution, nothing to change" if the trade went according to plan. But when something did go wrong or right in an unexpected way, capture it.
Examples: "Entered too early before confirmation candle closed." "Held through the pullback and reached full target, need to trust my stops more." "Added to winner at right level, should do this more on A-grade setups."
These one-liners become gold during weekly review. When you read 20 lessons in a row, themes jump out that you would never notice trade by trade.
What Tags Should You Add to Every Trade?
Beyond the 8 data points above, tags let you slice your data later. The right tags turn your journal into a searchable database. The wrong tags (or too many tags) create noise.
Start with 3-4 tag categories. Add more only after you have 50 trades and know what questions you want to answer.
Recommended starter tags:
Session: Pre-market, London, New York Open, Power Hour, After Hours. Tells you when you trade best.
Market Condition: Trending, Range, Choppy, High Volatility, Low Volatility. Tells you which environments suit your setups.
Confluence Count: 1 factor, 2 factors, 3+ factors. Tells you whether more confirmation actually improves your results or just causes hesitation.
Timeframe: 1M, 5M, 15M, 1H, 4H, Daily. If you trade multiple timeframes, this shows which one produces your best expectancy.
In TradeZella, Zella AI's Auto-Tagger can apply many of these tags automatically based on rules you define. For example: "tag all trades taken before 10:00 AM as Pre-Market," "tag trades on ES as Futures," "tag trades that went 2R or more as Strong Winner." You set the criteria once, and the agent applies them to every trade going forward. This is the difference between an AI trading journal and a manual spreadsheet.
Should You Take Screenshots of Every Trade?
Yes, if your platform makes it easy. Screenshots capture context that numbers cannot: what the chart looked like at the moment you made your decision. Memory is unreliable. After the trade is over, you will rationalize your entry or forget what the setup actually looked like in real time.
Take two screenshots at minimum: one at entry, one at exit. If you want to optimize your exits, take a third screenshot 30 minutes or one hour after your exit to see what happened next.
In TradeZella, the built-in TradingView chart shows your entry and exit markers directly on the price action, so the "screenshot" is already embedded in your journal. You can also add manual screenshots and notes through the Notebook feature.
Should You Track High and Low Prices?
This is an advanced input that most beginners can skip, but it becomes powerful once you have 50+ trades.
The high and low prices during your trade tell you about Maximum Favorable Excursion (MFE) and Maximum Adverse Excursion (MAE). MFE is how far price went in your favor before you exited. MAE is how far price went against you before you exited.
If your MFE is consistently 3R but you are closing at 1.5R, you are leaving money on the table. If your MAE is consistently -0.3R on winners but -1.5R on losers, your stop placement is inconsistent.
TradeZella calculates MFE and MAE automatically for every trade, so you do not need to manually track high and low prices. The analytics dashboard shows your exit efficiency, which tells you what percentage of the available move you actually captured.
How Do You Avoid Writing Too Much?
Set a five-minute timer. When the timer ends, your entry is done. This forces you to prioritize the data points that matter and skip the narrative that does not.
The 8 data points above can be completed in under three minutes for most trades. Strategy name (2 seconds), quality grade (1 second), rules followed (1 second), planned vs actual risk (10 seconds), trade reason (15 seconds), exit reason (10 seconds), emotion tag (2 seconds), one lesson (20 seconds). The rest is auto-imported.
If you find yourself writing paragraphs, you are journaling wrong. The journal is a data collection tool, not a diary. Save the analysis for your weekly review. For more on building a sustainable journaling habit, see our trading journal tips.
What Should You Review Weekly?
The data you write after each trade becomes useful during review. Set aside 30 minutes on Sunday and answer four questions from your journal data:
Which Strategy had the best profit factor this week? Compare your Strategies side by side. If one is below 1.0, it cost you money. Ask why.
What percentage of trades followed your rules? Filter by "Rules Followed" tag. Calculate your Rule Adherence Score. Below 75% means the problem is execution, not strategy.
Which emotion tag appeared most on losing trades? If "Rushed" or "Revenge" shows up repeatedly on red days, you have a specific behavioral pattern to address.
Was your planned risk close to your actual risk? If the gap averaged more than 20%, your sizing discipline needs work.
These four questions take 15-20 minutes with the right tools. In TradeZella, the Strategy comparison report, Tags report, P&L calendar, and R-Multiple View answer all four without manual calculation. For a deeper weekly review framework, see our guide on how to analyze your trading performance. For daily P&L pattern detection, use the P&L calendar method.
Track your win rate and profit factor by Strategy, not just overall. The overall numbers hide which setups are carrying you and which ones are dragging you down.
What If You Use Zella AI?
If you use TradeZella with Zella AI, several of these data points get handled for you automatically:
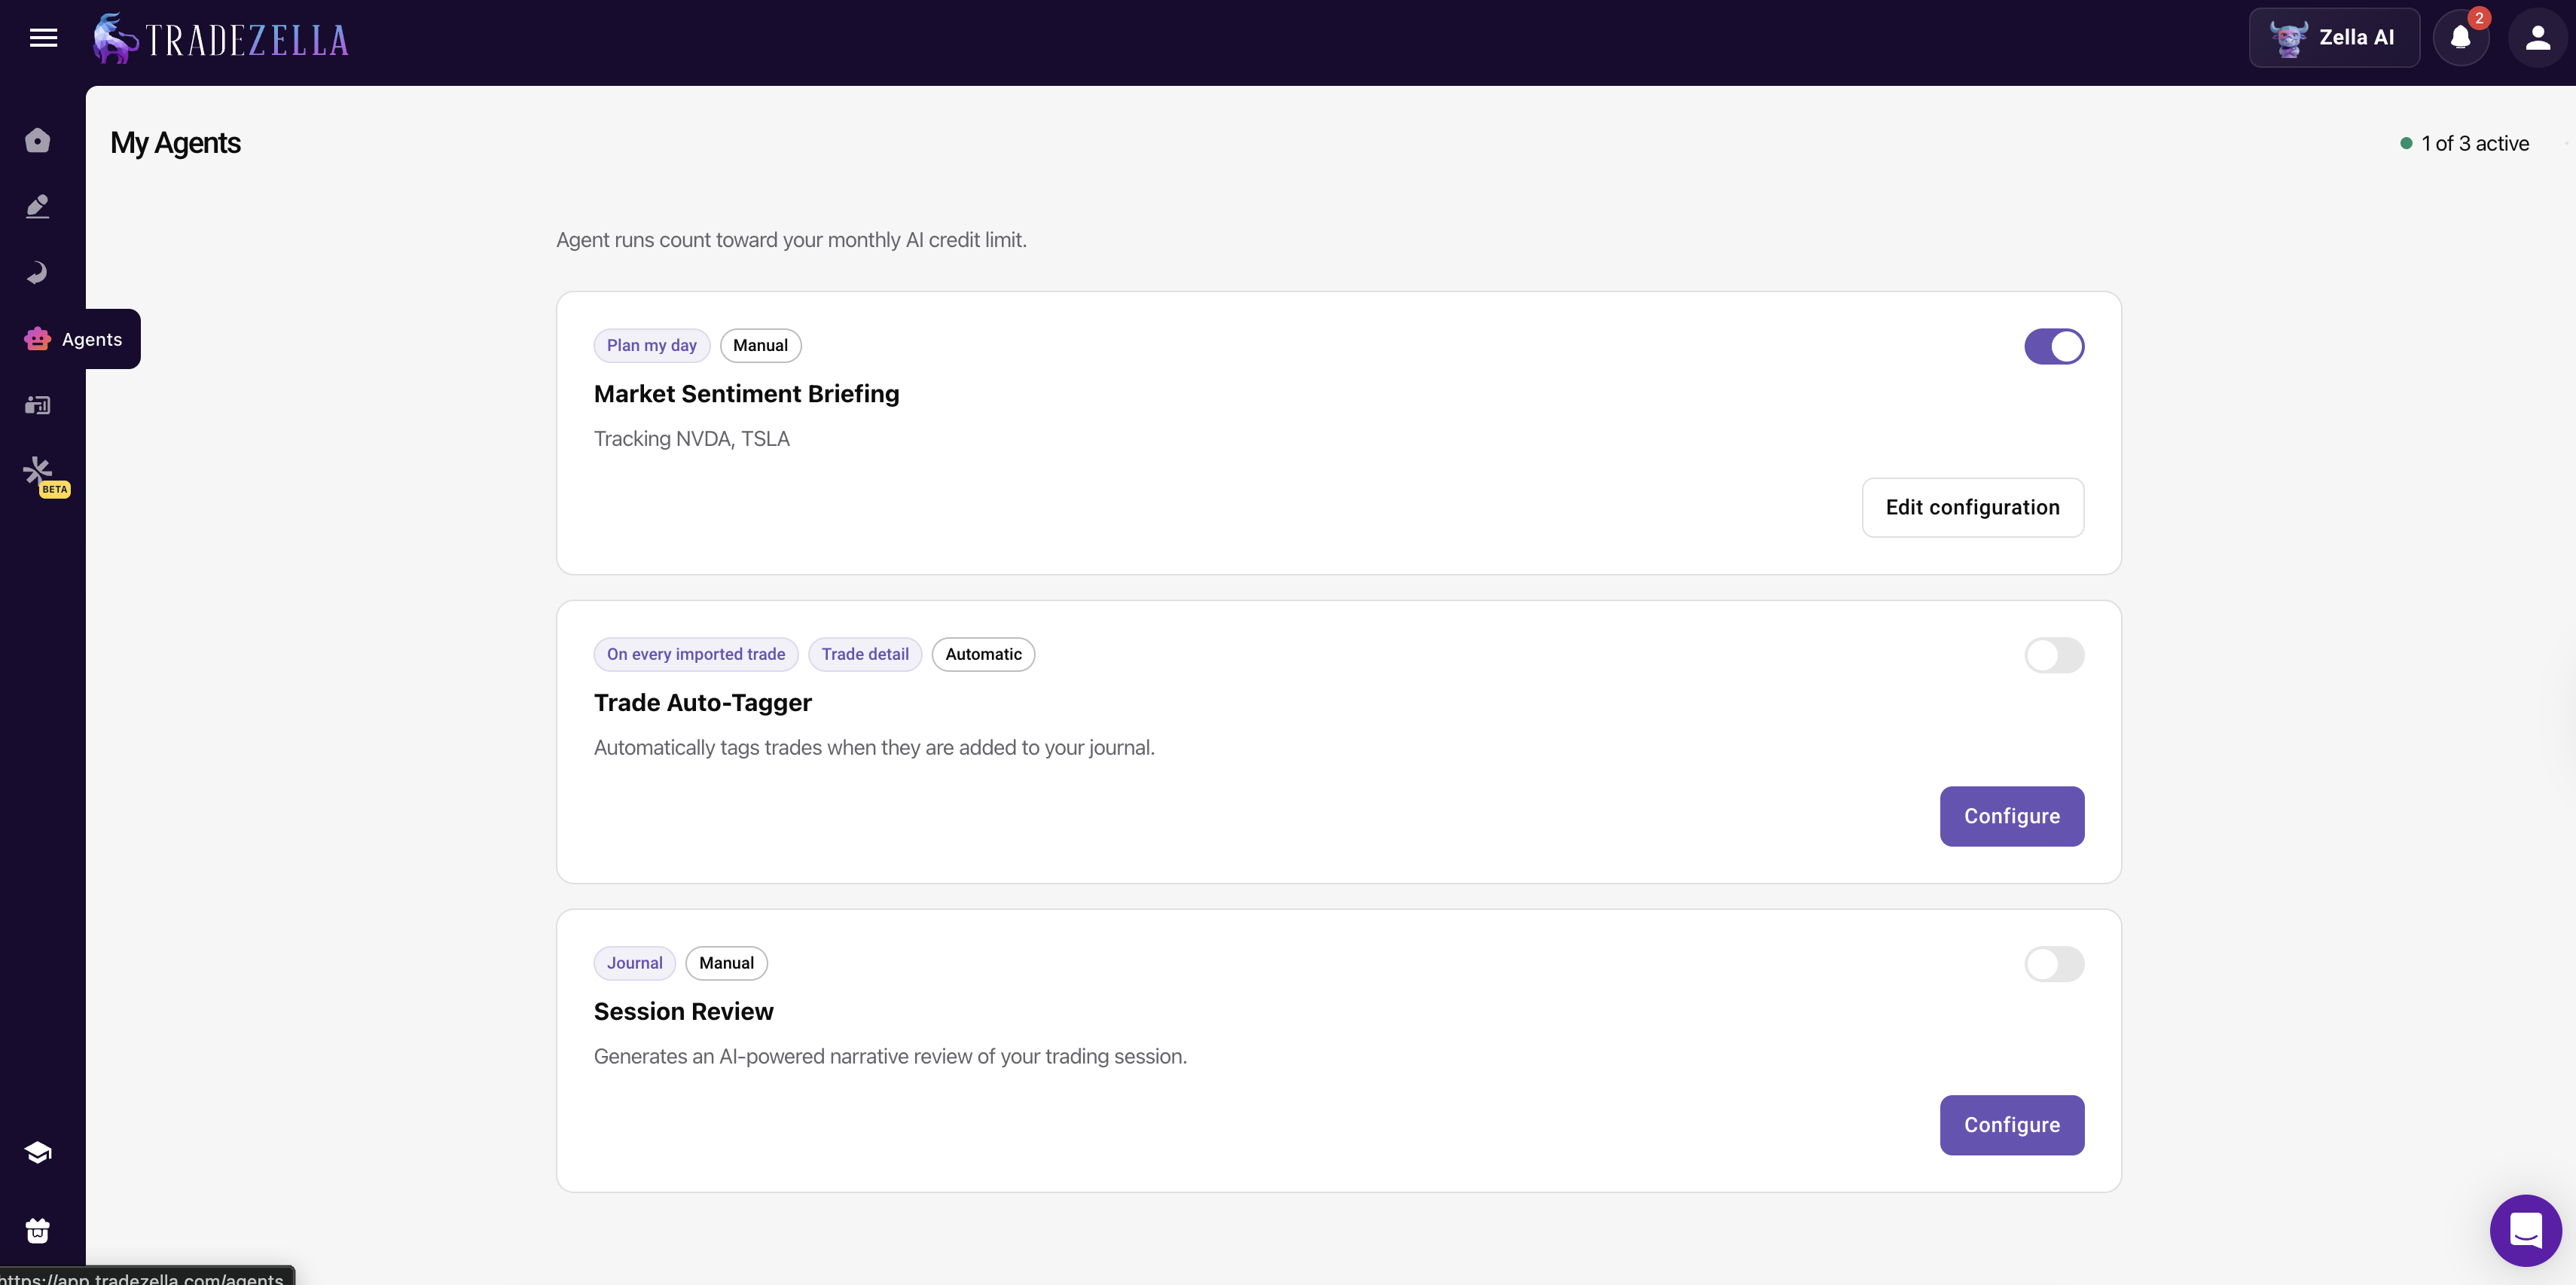
Auto-Tagger agent: Applies tags based on rules you define. "Tag all trades that went 2R or more," "tag trades by entry timeframe," "tag session based on time of execution." You configure the criteria once, and the agent tags every trade automatically.
Session Review agent: After your trading day, Session Review compares your morning plan vs your actual results. It checks rule adherence, flags deviations, and journals the entire session. The "one lesson" per trade becomes a full session-level review.
Market Sentiment Briefing agent: Before the trading day, this agent generates pre-market scenarios and a trading plan based on how you trade, your assets, and your setup criteria. Your "trade reason" field becomes "followed plan from morning briefing" because the plan already exists.
Zella AI Agents
This does not mean you stop writing. It means you write the high-value observations (quality grade, emotion, lesson) while the mechanical tagging and review happen automatically. The combination of human context and AI pattern detection is more powerful than either one alone.
Frequently Asked Questions
What should I write in my trading journal after every trade?
After every trade, record 8 data points: Strategy name (the setup you traded), quality grade (A, B, or C based on setup quality, not outcome), whether you followed your rules (yes or no), planned risk versus actual risk in dollars, trade reason (one sentence explaining why you entered), exit reason (one sentence explaining why you closed), emotion tag (one word describing your dominant emotion during the trade), and one lesson (one sentence about what the trade taught you). Mechanical data like entry price, exit price, position size, and fees should be auto-imported from your broker.
How long should a trading journal entry take?
A complete journal entry should take under five minutes. If your broker connects to your journaling platform, the mechanical data imports automatically and takes zero time. The 8 contextual data points (Strategy name, quality grade, rules followed, planned versus actual risk, trade reason, exit reason, emotion tag, and one lesson) take two to three minutes for most trades. Set a five-minute timer to prevent over-writing.
What tags should I use in my trading journal?
Start with three to four tag categories: session (Pre-Market, London, New York Open, Power Hour), market condition (Trending, Range, Choppy, High Volatility), confluence count (1 factor, 2 factors, 3 or more factors), and timeframe (1 minute, 5 minute, 15 minute, and so on). Add more tag categories only after you have 50 trades logged and know which questions you want to answer. Too many tags too early creates friction and reduces consistency.
Should I take screenshots of every trade?
Yes, if your platform makes it easy. Screenshots capture what the chart actually looked like when you made your decision, which is important because memory is unreliable. Take at minimum one screenshot at entry and one at exit. Some traders take a third screenshot 30 minutes or one hour after exit to evaluate whether their exit timing could improve. In TradeZella, the built-in TradingView chart marks your entry and exit automatically, so screenshots are already embedded in every journal entry.
What is the most important thing to write in a trading journal?
The most important data point is whether you followed your rules (yes or no for entry, trade management, and exit). This single field lets you calculate your Rule Adherence Score and separate system performance from execution mistakes. Most traders who track this discover that their strategy performs better than they thought, and the real damage comes from the trades where they broke their own rules.
How is this different from a trade log?
A trade log records what happened: entry price, exit price, profit or loss. A trading journal records what happened and why it happened: the setup you traded, the quality of the setup, whether you followed your rules, the emotions you felt, and what you learned. The trade log tells you that you lost 500 dollars. The journal tells you that you lost 500 dollars because you entered a C-grade setup while feeling frustrated after a previous loss, which is revenge trading, and now you can measure how often that pattern repeats and what it costs you.
Can Zella AI write my journal for me?
Zella AI automates specific parts of the journaling process but does not replace human input entirely. The Auto-Tagger agent applies tags based on rules you define (session, timeframe, R-multiple thresholds). The Session Review agent compares your morning plan against your actual results and journals the entire session automatically. Mechanical data imports from your broker without manual entry. However, quality grades, emotion tags, and personal lessons require your input because only you know the context behind each decision. The combination of AI automation and human context produces a more complete journal than either approach alone.