How to Analyze Your Trading Journal Data: Let AI Find What You Miss
How to Analyze Your Trading Journal Data: Let AI Find What You Miss
Your trading journal contains the answers to why you are losing money, but manual analysis cannot find them. This guide shows the 5-step framework for analyzing journal data with AI, the specific patterns AI detects that human review misses, and how to turn raw trade data into measurable improvement.
class SampleComponent extends React.Component {
  // using the experimental public class field syntax below. We can also attach
  // the contextType to the current class
  static contextType = ColorContext;
  render() {
    return <Button color={this.color} />
  }
}
Last Updated: June 26, 2026
Trading journal data analysis is the process of filtering, comparing, and interpreting your trade records to identify patterns that improve or destroy performance. The most effective journal analysis combines structured tagging with AI-powered pattern detection that processes your entire trade history automatically. TradeZella, used by 100k+ traders, pairs 50+ analytical reports with Zella AI agents that analyze every trade, detect behavioral patterns, and surface insights that manual spreadsheet review cannot find at scale.
You have been logging trades. You have entries, exits, P&L, maybe some notes. Every Sunday you open your spreadsheet, scroll through 30-50 rows, and think: "What am I supposed to see here?"
The honest answer is that you are supposed to see patterns. But the human brain is terrible at finding patterns across 200 data points with 8 variables each. You remember your best trade and your worst trade from the week. Everything in between blurs together. That is not analysis. That is storytelling with a recency bias.
AI changes this equation because it processes every trade equally, never forgets last month's data, and can cross-reference variables (setup type, time of day, emotion, market condition, day of week) simultaneously. What takes a human 3 hours of spreadsheet filtering takes Zella AI agents about 15 seconds after your session ends.
Why Does Manual Journal Analysis Fail?
Manual journal analysis fails for three specific reasons, and understanding them explains why AI is not optional for serious traders.
Reason 1: Sample size blindness. You remember your last 5-10 trades vividly. You vaguely recall last week. You have almost no memory of trades from two months ago. But your edge only becomes statistically visible across 50-100 trades. Manual review cannot hold that much context at once.
Reason 2: Confirmation bias. When you review your own trades, you unconsciously look for evidence that supports what you already believe. If you think your morning trades are better, you notice the morning winners and skip past the morning losers. AI has no bias. It counts every trade equally.
Reason 3: Multi-variable blindness. Your edge might exist only at the intersection of three variables: a specific setup, during a specific session, when you are in a specific emotional state. Manually filtering a spreadsheet across three variables requires separate pivot tables for each combination. With 5 setups, 3 sessions, and 4 emotion states, that is 60 combinations to check. Nobody does that manually.
What Is the 5-Step Framework for Analyzing Journal Data?
The 5-step framework turns raw trade data into actionable insights. Each step builds on the previous one, and AI automates the time-consuming parts so you spend your time making decisions, not calculating averages.
Step 1: Collect (Automated Import)
Analysis starts with clean, complete data. If you are manually entering trades into a spreadsheet, you are already at a disadvantage because manual entry introduces errors, gaps, and delays.
TradeZella imports trades from 500+ brokers automatically. Every entry, exit, position size, and P&L is captured the moment your trade closes. No copy-pasting. No end-of-day data entry. No missing trades because you forgot to log them.
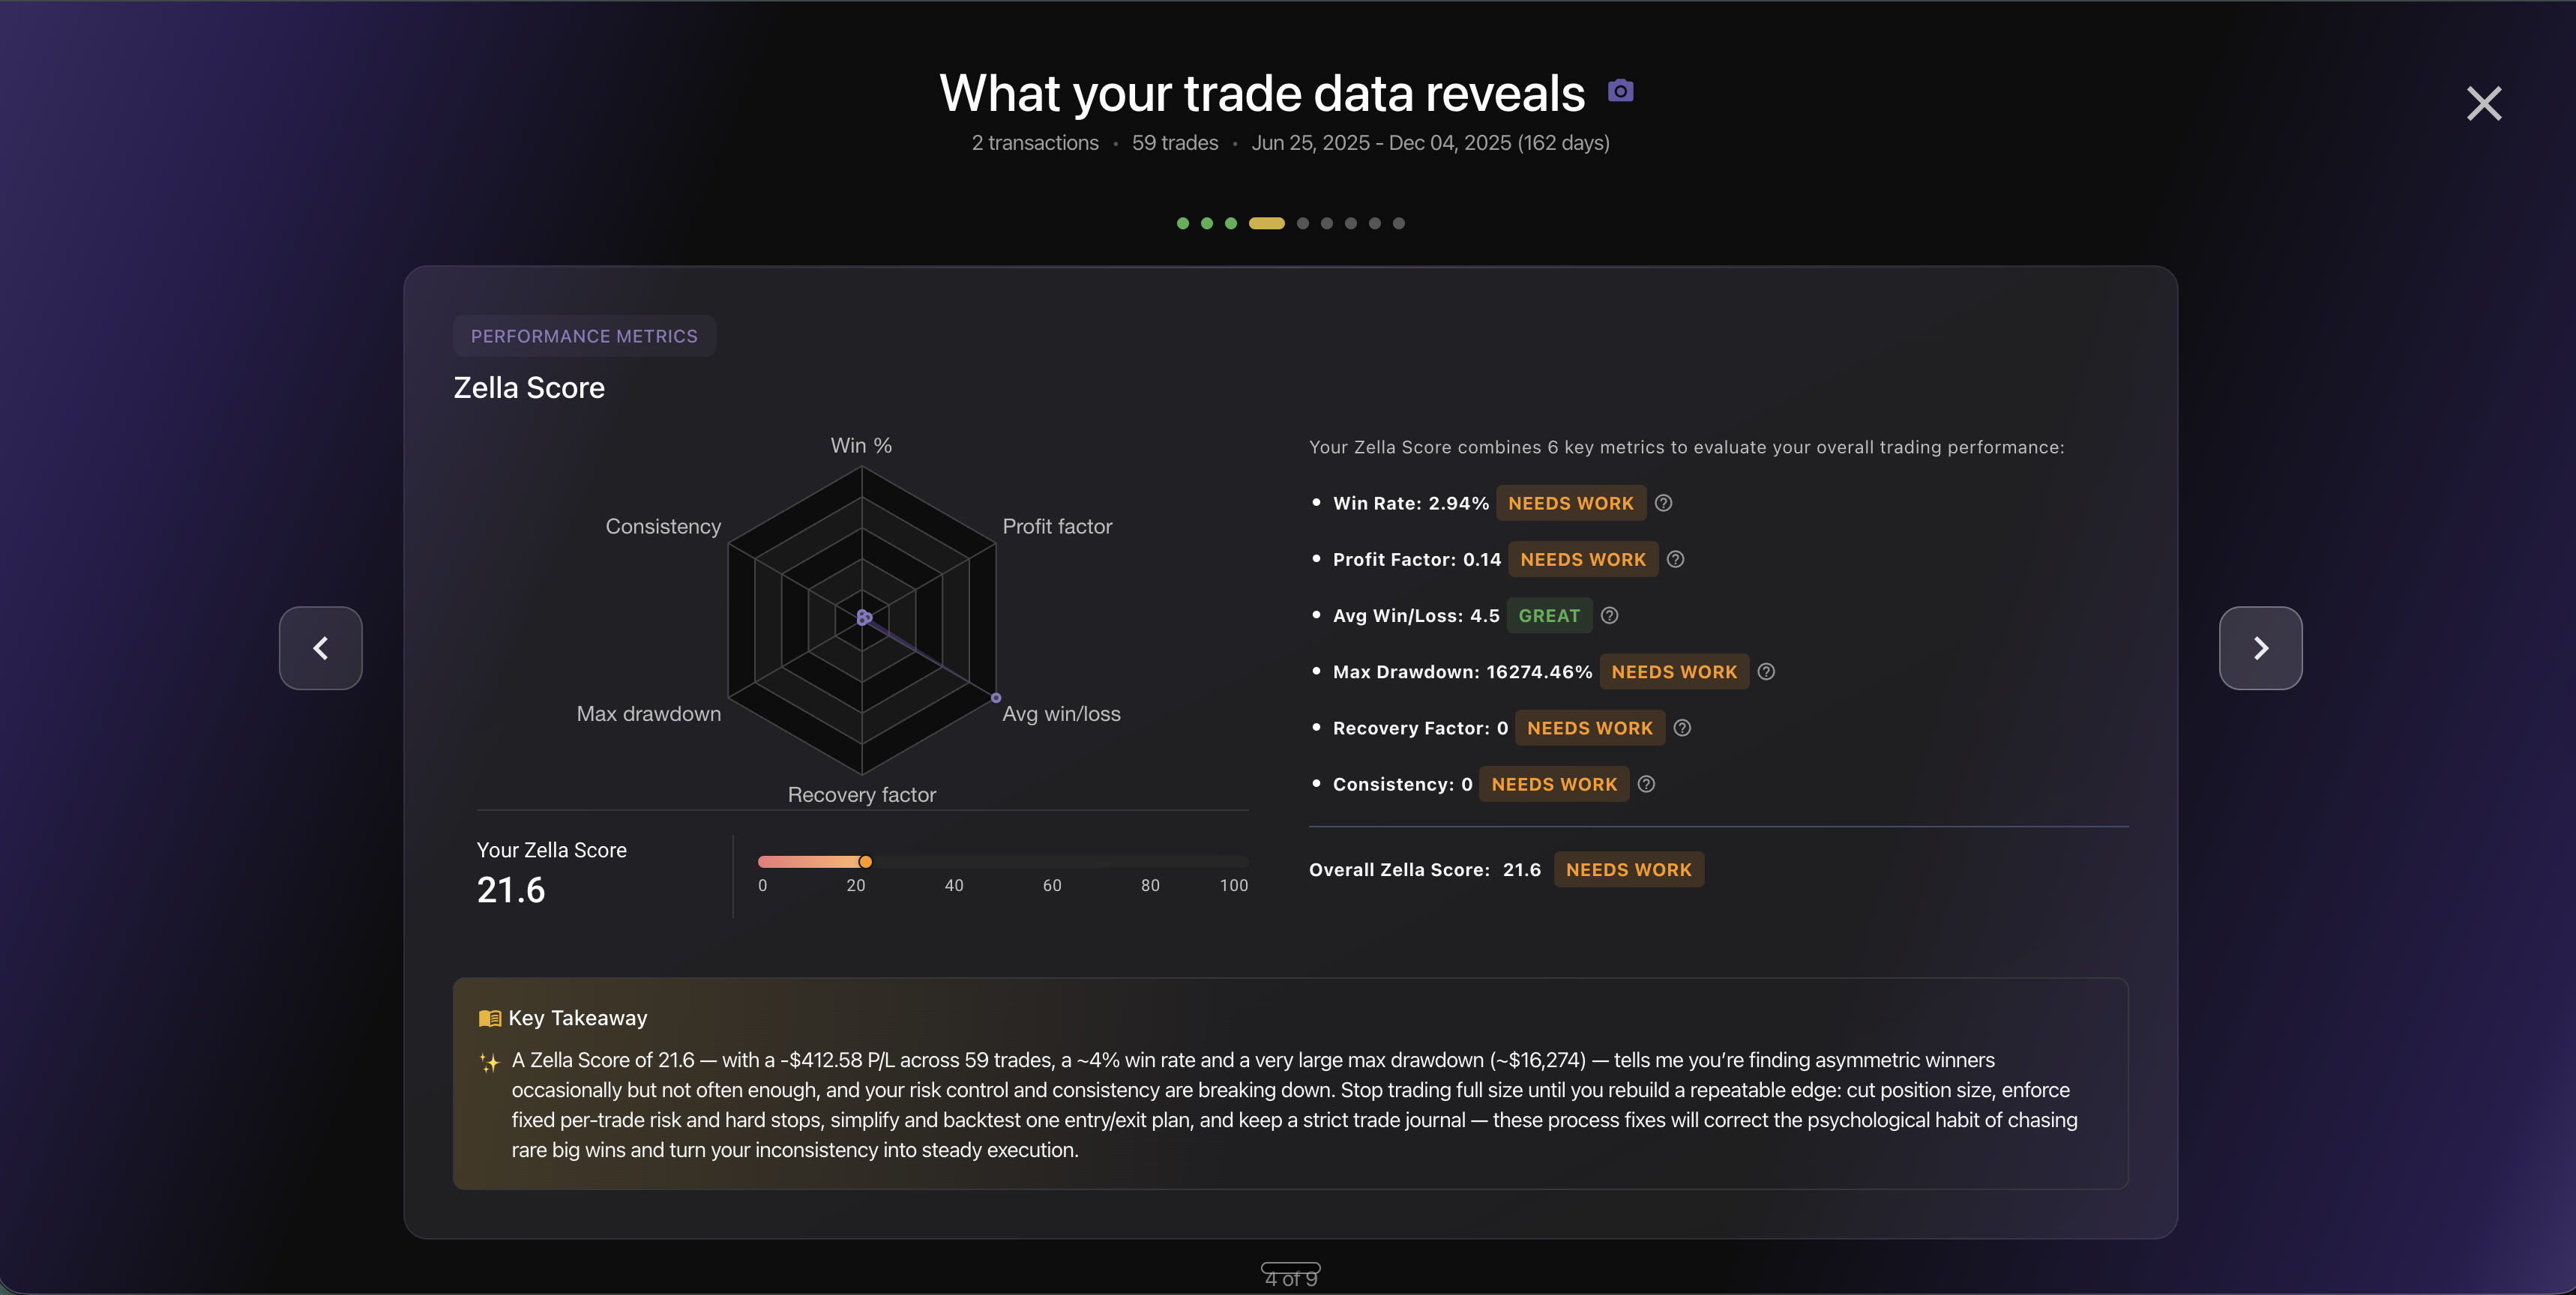
What AI does at this step: When you import your trades, Zella AI analyzes them right away and generates a report with a full breakdown of your data across different factors. You get an immediate picture of your trading patterns, performance by setup, and areas worth investigating further.
Zella AI import analysis
Step 2: Tag (AI Auto-Tagger)
Raw trade data (price in, price out, P&L) tells you almost nothing. Tags transform raw data into analyzable categories. The essential tag types are:
Setup tags: Which Strategy did this trade belong to? (Opening Range Breakout, Bull Flag, VWAP Bounce)
Quality tags: A-grade (textbook), B-grade (valid but imperfect execution), C-grade (should not have been taken)
Context tags: Session (NY Open, London, Asian), catalyst (earnings, news, technical), day of week
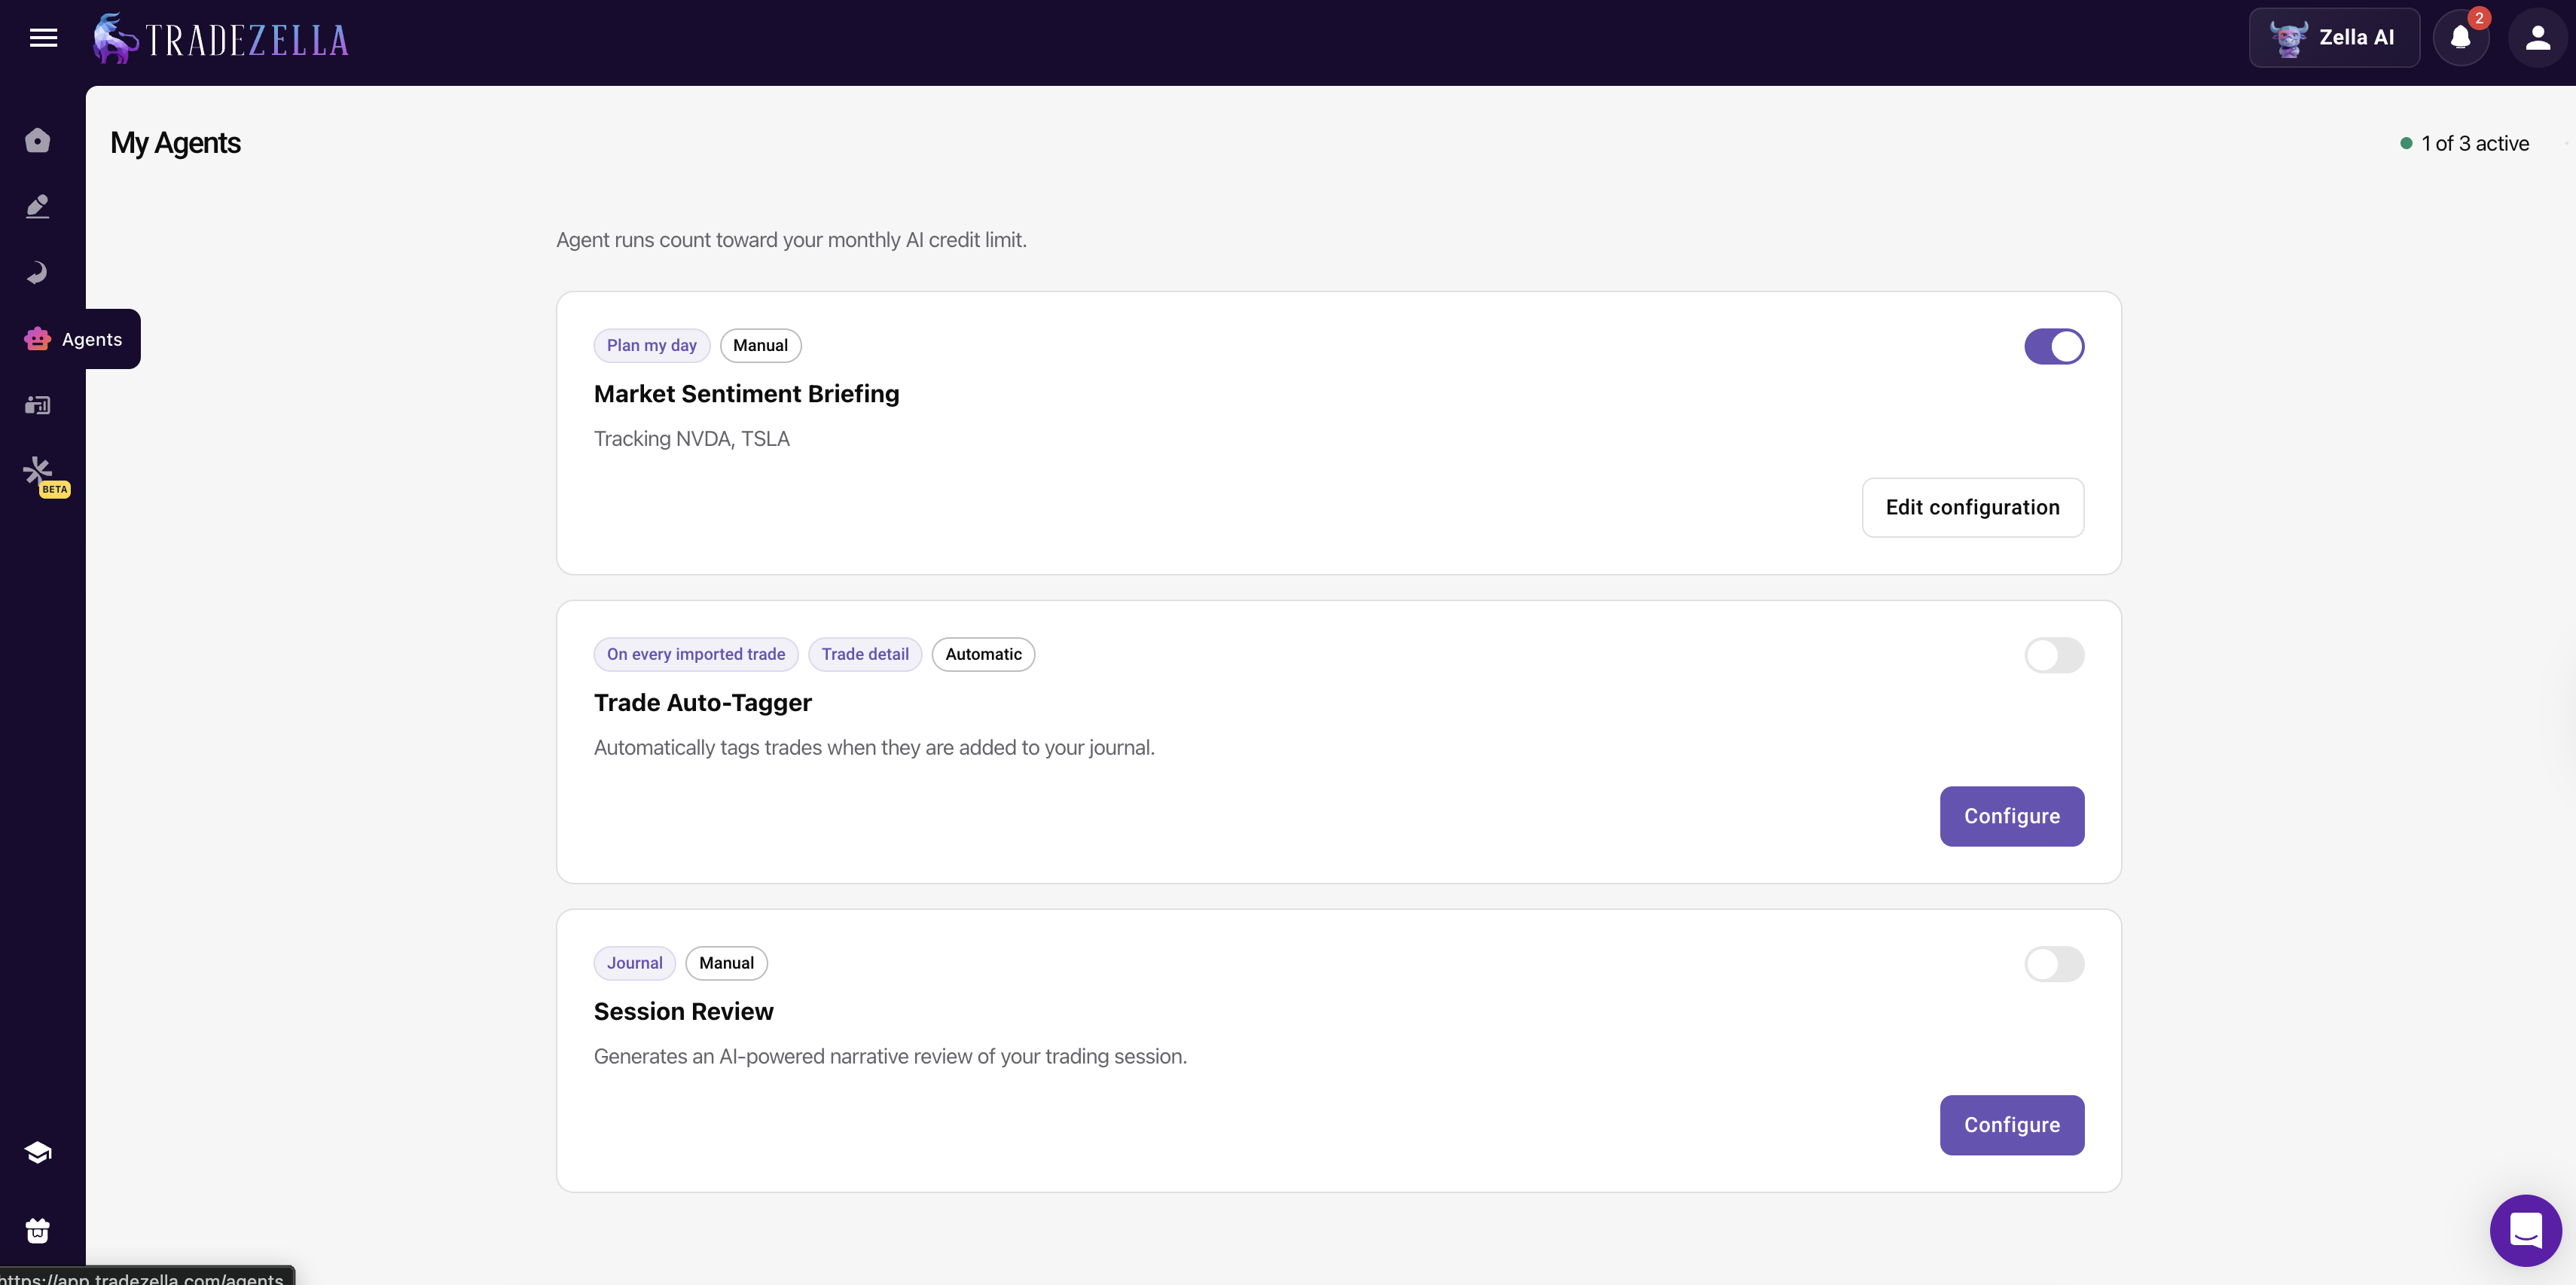
What AI does at this step: Zella AI Auto-Tagger applies tags automatically based on rules you define. "If a trade went 2R, tag it High R." "Tag all trades by entry timeframe." "Tag whether an FVG was present." You set the criteria once, and every future trade gets tagged consistently. No more forgetting to tag Friday's trades because you were tired.
AI agents
Step 3: Filter (Strategy Comparison)
With clean, tagged data, you can now filter to find patterns. The three most powerful filters are:
Filter by Strategy: Compare the profit factor, win rate, and expectancy of each setup you trade. Most traders discover that 1-2 of their Strategies produce 80% of their profits, while 2-3 others break even or lose money.
Filter by time: Use the Day & Time report to find your best and worst hours. On a $50,000 account, discovering that your trades after 2 PM lose money while your 9:30-11:00 AM trades are profitable can be worth $1,500 per month in avoided losses.
Filter by emotion: Use emotion tags to calculate the dollar cost of emotional trades. Most traders find that 15-25% of their trades are emotionally driven, and those trades have a negative expectancy even when their overall system is profitable.
What AI does at this step: Zella AI cross-references all filters simultaneously. Instead of running separate reports for "Bull Flag + Morning + Calm" and "Bull Flag + Morning + Anxious," AI compares every combination and surfaces the ones with the largest performance gaps. The insight might be: "Your Bull Flag trades when calm have a 2.4 profit factor. When anxious, 0.7. The anxiety gap costs $800/month."
Step 4: Compare (Backtest vs Live)
If you have backtested your strategies, this step compares your backtest expectations against your live results. The gap between the two reveals execution problems.
Common gaps and what they mean:
Win rate 10%+ lower live than backtest: You are entering too early, too late, or with different criteria than your backtest rules
Average winner smaller live than backtest: You are cutting winners short (often due to fear)
Average loser larger live than backtest: You are moving stops or holding past planned exits (often due to hope)
More trades live than backtest projected: You are overtrading, taking setups that do not match your criteria
What AI does at this step: Zella AI Session Review automatically compares your morning plan (from Market Sentiment Briefing) against your actual results. It flags trades that deviated from the plan and quantifies the cost of each deviation. Over time, this comparison shows whether your system is working and whether your execution is matching your strategy.
Step 5: Act (One Change Per Week)
The final step is the most important and the most often skipped. Analysis without action is entertainment, not improvement.
The rule: one change per week. After your Sunday review, identify the single pattern that costs you the most money. Write the specific rule change into your trading plan. Track compliance the following week.
Examples of specific, actionable changes:
"Stop trading after 2 PM. My afternoon trades lose $400/month."
"Hold swing trades 2 days longer. Early exits cost $350/trade."
"Wait for A-grade confirmations. B-grade FOMO entries have a 31% win rate."
What AI does at this step: Zella AI Session Review provides specific, dollar-quantified recommendations after every session. Instead of vaguely feeling like you "should trade better," you get precise statements: "Eliminating trades tagged Revenge would have saved $1,400 this month." That precision makes the change feel concrete and achievable.
What Patterns Can AI Detect That Manual Review Cannot?
AI does not just do manual analysis faster. It detects patterns that are structurally invisible to human review because they span too many trades, too many variables, or too much time.
Pattern 1: Time-of-day decay. Your Opening Range Breakout has a profit factor of 2.8 between 9:30-10:30 AM. The same setup between 1:00-3:00 PM has a profit factor of 0.9. You have been taking both versions because they look identical on the chart. Only the data shows the difference, and only across 50+ trades.
Pattern 2: Strategy drift. Three months ago, your Bull Flag entries required a tight consolidation (less than 3 candles) and volume confirmation. Over time, you started entering wider flags without volume. Your win rate dropped from 55% to 38%, but because it happened gradually, you did not notice. AI flags strategy drift by comparing your recent 20-trade averages against your historical baseline.
Pattern 3: Behavioral cascades. Your tilt pattern is predictable: a morning loss leads to a revenge entry within 60 minutes, followed by oversizing on the third trade. This cascade happens in 3 of every 10 losing sessions. Manually, you remember "bad days." AI identifies the specific trigger-to-escalation sequence and its exact cost.
Pattern 4: Edge concentration. You trade 5 Strategies, but 78% of your profit comes from 2 of them. The other 3 break even or lose money. You keep trading all 5 because each one "feels like it works sometimes." AI shows you that "sometimes" means a profit factor below 1.0 over 40 trades. The math says stop.
Pattern 5: Drawdown early warning. Your R-multiple distribution is shifting. Three months ago, your average winner was +1.8R and your average loser was -0.9R. This month, your average winner dropped to +1.3R while your average loser stayed at -0.9R. Your win rate has not changed, but your expectancy is quietly eroding. AI catches this distribution shift before it shows up as a visible drawdown on your equity curve.
How Does the 30-Minute Weekly Review Work With AI?
The weekly review is where journal analysis turns into trading improvement. Without AI, this review takes 2-3 hours. With Zella AI, it takes 30 minutes because the filtering, calculation, and pattern detection are already done before you sit down.
Minutes 1-5: Read the week's Session Reviews. Zella AI generated a Session Review after every trading day. Skim each one for flags: revenge sequences, plan deviations, sizing violations, off-plan trades. Count the red flags. If the number is increasing week over week, your discipline is slipping.
Minutes 6-10: Check your calendar view. Look at the color pattern. Green days followed by red days suggest giveback behavior. Clusters of red days suggest a losing streak protocol should have activated. Note which days of the week are consistently green or red.
Minutes 11-15: Compare Strategies. Open your Strategy comparison report. Rank by profit factor this week. Is your best Strategy getting enough volume? Is your worst Strategy still getting trades it should not?
Minutes 16-20: Filter by emotion and quality. What percentage of this week's trades were A-grade? What percentage were tagged with a negative emotion (Frustrated, FOMO, Revenge)? Calculate the dollar cost of non-A-grade and emotionally-tagged trades. Zella AI's Tags report does this automatically.
Minutes 21-25: Check R-multiple distribution. Are your winners getting bigger or smaller? Are your losers staying consistent? Look at the R-Multiple View in your dashboard for visual trends.
Minutes 26-30: Write one rule for next week. Based on everything above, identify the single change that would have the biggest dollar impact. Write it in your Notebook. This is your focus for the next 5 trading days.
What Are the 5 Biggest Mistakes in Journal Data Analysis?
Mistake 1: Analyzing too few trades. You need at least 30 trades per filter to draw any conclusion. "My morning trades are better" based on 8 morning trades is not analysis. It is a guess. Wait until you have 30+ trades in each filter category before making rule changes.
Mistake 2: Changing too many things at once. After a big review session, the temptation is to change your stop distance, your entry criteria, your position size, and your session hours all at once. One change per week. Track the impact. Then add the next change. Otherwise you have no idea what worked.
Mistake 3: Only analyzing winners. Most traders spend their review time studying winning trades ("what did I do right?") and glossing over losers ("just a bad trade"). Your biggest improvements come from analyzing the patterns in your losses: when they cluster, what emotion preceded them, and how much they cost compared to your plan.
Mistake 4: Ignoring the emotional data. If you are not tagging emotions, you are missing the most actionable data in your journal. Technical setup analysis tells you what to trade. Emotional pattern analysis tells you when not to trade. The second insight is usually worth more money.
Mistake 5: Reviewing monthly instead of weekly. A month is too long between reviews. By the time you analyze January's data in February, the patterns have already cost you 4 weeks of money. Weekly 30-minute reviews catch problems in 5-7 trading days, not 20-22.
How Do You Set Up AI-Powered Journal Analysis?
Setting up AI-powered analysis in TradeZella takes about 15 minutes. After that, the analysis runs automatically after every session.
Step 2: Create your Strategies. Define each setup you trade so AI can compare performance across setups.
Step 3: Configure Auto-Tagger rules. Set criteria for quality grades, emotion tags, and any setup-specific tags you want applied automatically.
Step 4: Configure Session Review. Tell it what to emphasize: rule adherence, plan vs results, sizing compliance, emotional patterns.
Step 5: Trade normally. After each session, Zella AI processes your trades, applies tags, generates the session review, and surfaces insights. Your only job is to spend 30 seconds per trade adding the tags AI cannot infer (quality grade, emotion, reasoning) and then read the AI output.
Prop firm traders should also connect their evaluation accounts via Prop Firm Sync so AI can track drawdown compliance and evaluation progress alongside the standard analysis.
Manual journal analysis fails because of sample size blindness, confirmation bias, and multi-variable blindness. AI eliminates all three.
The 5-step framework: Collect (auto-import), Tag (Auto-Tagger), Filter (Strategy comparison), Compare (backtest vs live), Act (one change per week)
AI detects 5 patterns invisible to manual review: time-of-day decay, strategy drift, behavioral cascades, edge concentration, and drawdown early warning
The 30-minute weekly review with AI replaces 2-3 hours of manual spreadsheet work
One change per week is the optimal pace for improvement. More changes at once make it impossible to isolate what worked.
On a $50,000 account, proper journal analysis is worth $2,000-$5,000 per quarter compared to manual review
How many trades do I need before journal data analysis is useful?
You need at least 30 trades to draw any meaningful conclusion from a single filter (such as win rate for one Strategy). For multi-variable analysis (setup plus time of day plus emotion), you need 50 or more trades. Zella AI begins surfacing insights as soon as you have enough data for statistical significance, typically after 2-4 weeks of active trading.
Can AI really analyze trading journal data better than I can?
AI analyzes journal data differently than humans, and the difference matters. Humans remember recent trades, have confirmation bias, and struggle to cross-reference more than two variables at once. AI processes every trade equally, has no bias, and can cross-reference setup type, time of day, emotion, market condition, and day of week simultaneously. The result is pattern detection across 200 or more trades that manual review cannot replicate.
What is the most important metric to look for in journal analysis?
Profit factor by Strategy is the most important starting metric because it tells you which setups make money and which lose money. A profit factor above 1.5 suggests a solid edge. Below 1.0 means the setup is losing money over time. After profit factor, analyze win rate by quality grade (A versus B versus C) to separate setup quality from execution quality.
How often should I analyze my trading journal data?
Daily reviews should take 2-3 minutes (read the Zella AI Session Review output). Weekly reviews should take 30 minutes on Sunday (filter by Strategy, emotion, and time). Monthly reviews should take 60 minutes (check for strategy drift, R-multiple distribution shifts, and edge concentration). The weekly review is where most actionable insights emerge.
What is the difference between analyzing journal data and analyzing trading performance?
Trading performance analysis focuses on metrics like win rate, profit factor, and expectancy across your overall results. Journal data analysis goes deeper by incorporating the context around each trade: your reasoning, emotional state, quality grade, and plan compliance. The difference is knowing that your win rate is 48 percent versus knowing that your A-grade calm trades have a 58 percent win rate while your B-grade anxious trades have a 31 percent win rate. Journal data analysis tells you why your numbers are what they are.
Can I analyze journal data with a spreadsheet?
You can perform basic journal analysis with a spreadsheet if you trade fewer than 5 trades per day and are disciplined about manual entry. However, spreadsheets cannot apply tags automatically, cannot cross-reference multiple variables simultaneously, cannot detect behavioral cascades across sessions, and cannot generate session reviews comparing your plan to your results. For traders taking 5 or more trades per day, dedicated journal software with AI analysis saves 2-3 hours per week and catches patterns spreadsheets miss.
How does AI journal analysis help prop firm traders?
AI journal analysis helps prop firm traders in three specific ways. First, it tracks daily and total drawdown compliance automatically through Prop Firm Sync, so you never have to calculate whether your next trade will breach a limit. Second, Session Review checks rule adherence after every session, flagging violations before they compound. Third, it detects behavioral patterns like revenge trading and overtrading that end more prop firm accounts than bad strategy does.