How to Choose Backtesting Software: The 6 Factors That Actually Matter
How to Choose Backtesting Software: The 6 Factors That Actually Matter
Most traders pick backtesting software based on charting quality or brand recognition, then discover the platform cannot do what they need six months later. This guide breaks down the 6 evaluation factors that actually determine whether backtesting software will improve your trading, from rule definition method and data quality to journal integration and total cost of ownership.
class SampleComponent extends React.Component {
  // using the experimental public class field syntax below. We can also attach
  // the contextType to the current class
  static contextType = ColorContext;
  render() {
    return <Button color={this.color} />
  }
}
Last Updated: June 24, 2026
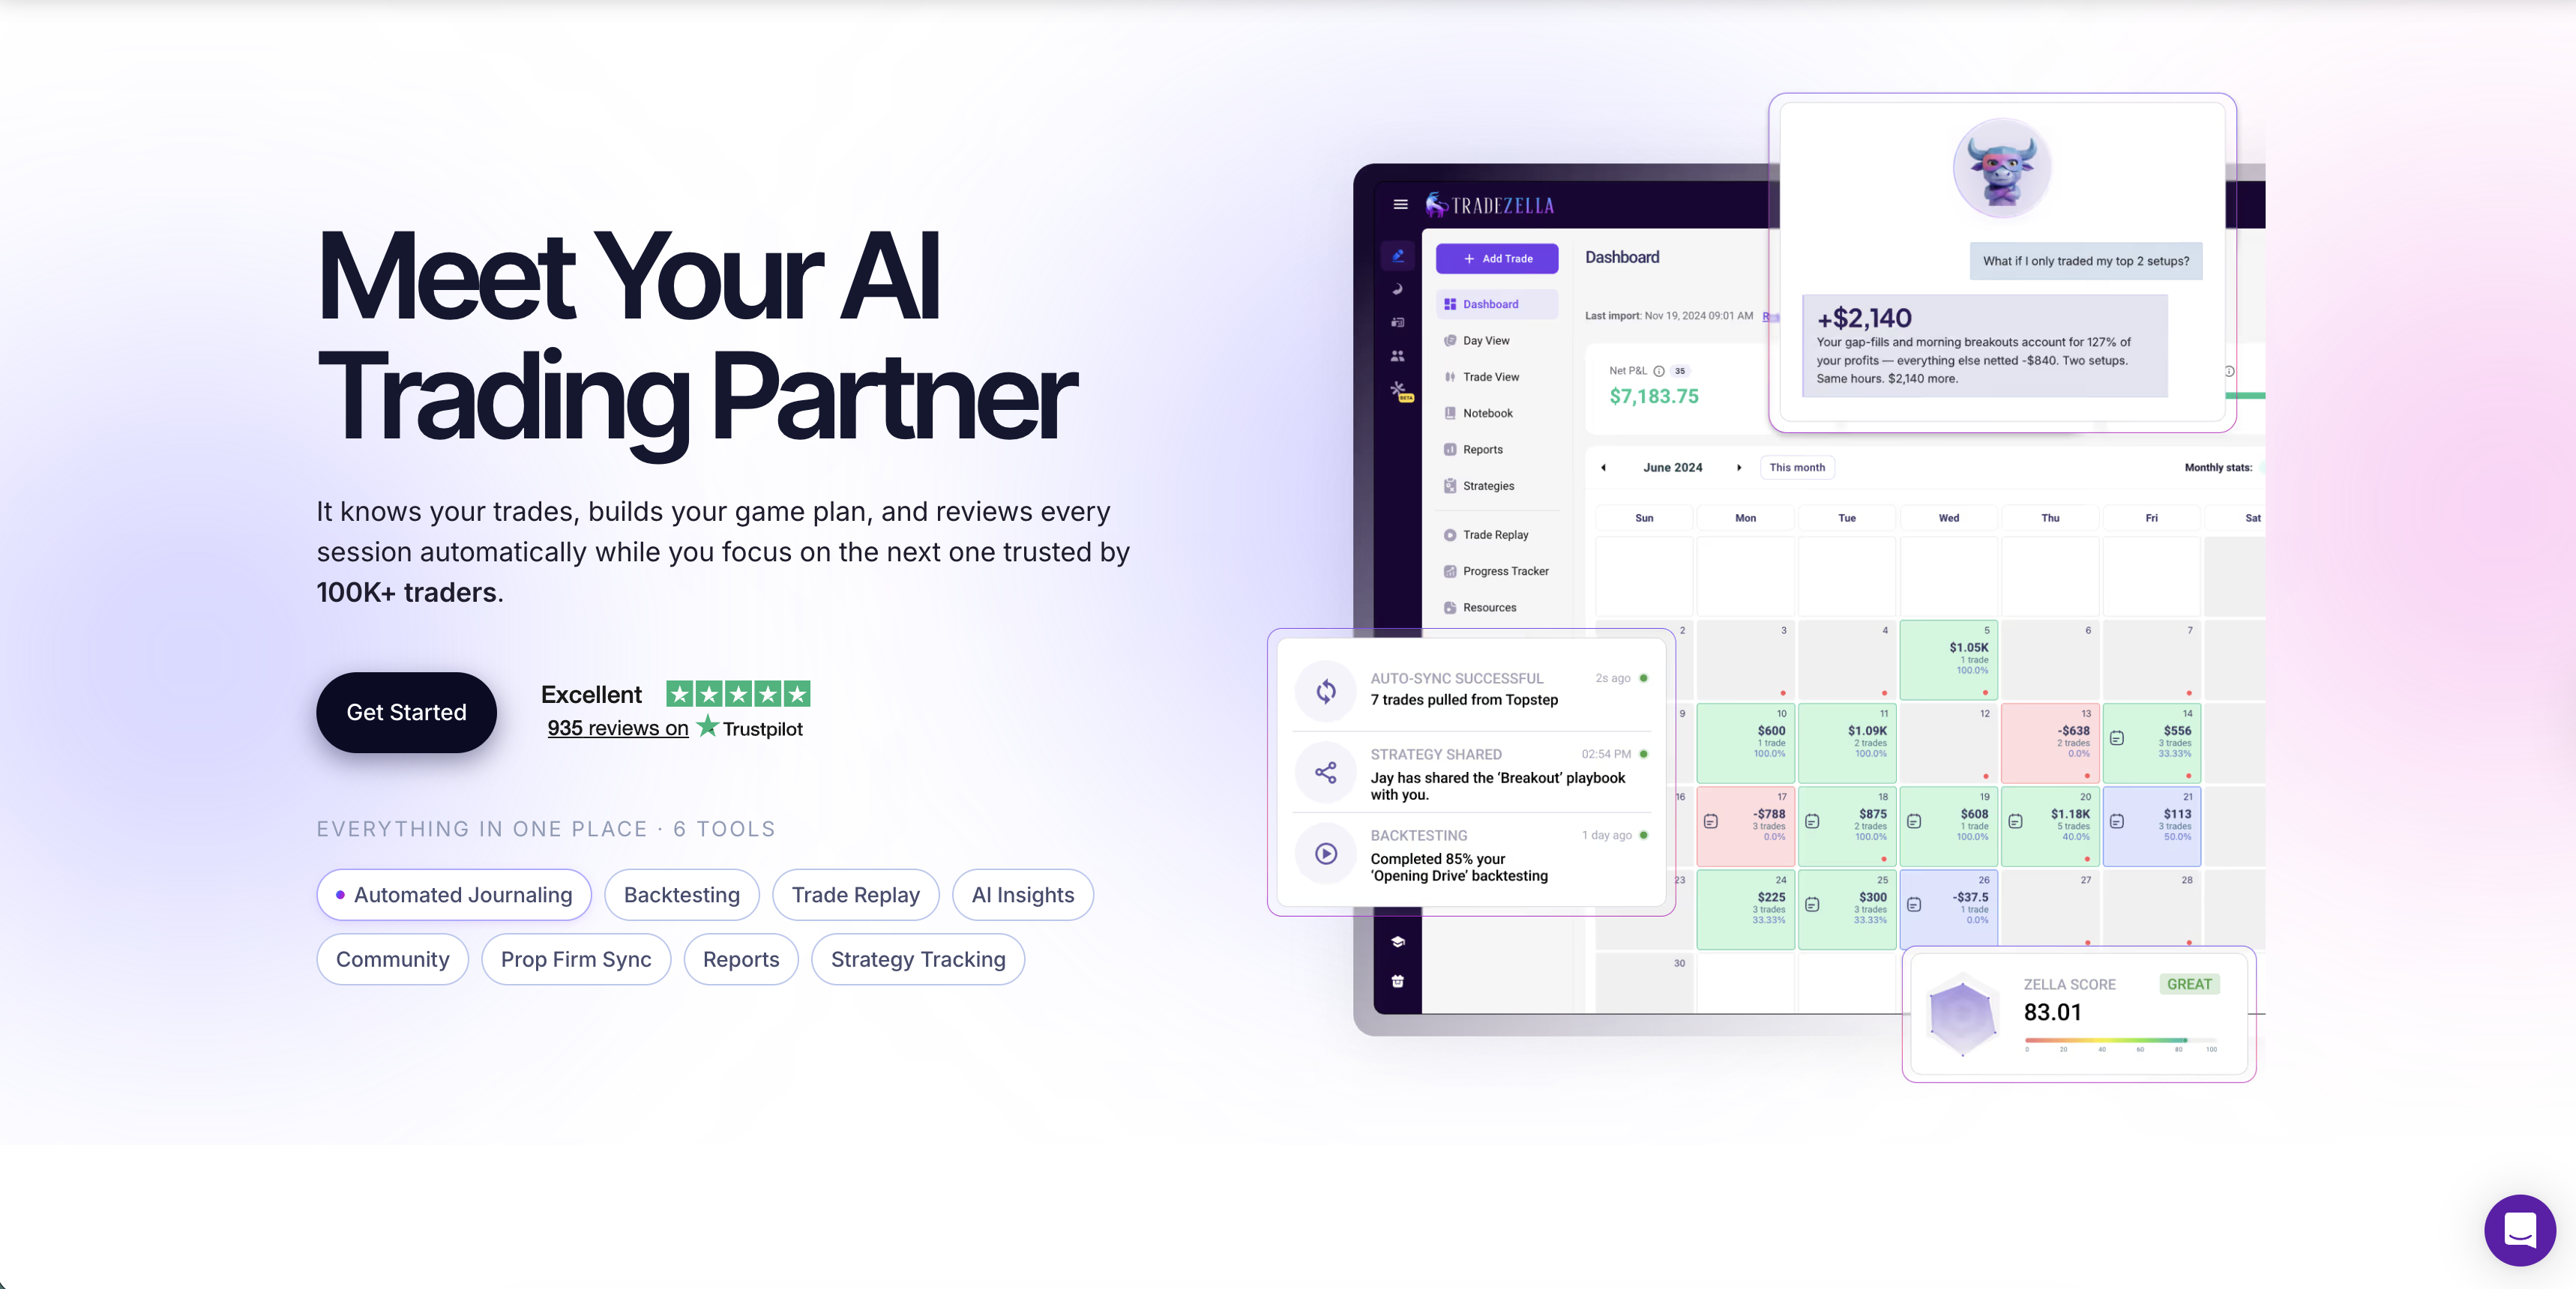
Backtesting software is a tool that lets traders test strategies against historical market data before risking real capital. The right backtesting platform validates your strategy with statistical evidence, connects those results to your live trading, and saves hundreds of hours of manual work. The wrong platform wastes your subscription fee and leaves you testing on one tool, journaling on another, and analyzing on a third. TradeZella is the only platform that combines automated backtesting with plain English rules, manual replay, an integrated trading journal, 50+ analytics reports, and Zella AI analysis in a single platform.
Most traders choose backtesting software the wrong way. They look at charting quality, pick a platform their favorite YouTube trader promotes, or default to whatever their broker offers. Then they discover, six months and several hundred dollars later, that the platform cannot do what they actually need.
The problem is not a shortage of options. There are dozens of backtesting platforms on the market, from free TradingView scripts to $200/month institutional-grade tools. The problem is that traders evaluate the wrong things. A beautiful chart does not help if you cannot see individual trades. A powerful scripting engine does not help if you spend four weeks learning Pine Script before testing your first strategy.
If you want to compare specific platforms head to head, read the best backtesting software comparison. This guide is different. It teaches you how to evaluate any backtesting platform so you can make the right choice for your trading style, experience level, and budget. Whether you are backtesting trading strategies for the first time or switching from a platform that is not working, these 8 factors determine whether your backtesting software will actually improve your results.
Factor 1: How Do You Define Your Rules?
The rule definition method is how you tell the software what to test. This is the single most important factor for most retail traders because it determines whether you will actually use the platform or abandon it after two frustrating sessions.
There are four levels of rule definition, ranked from easiest to most technical:
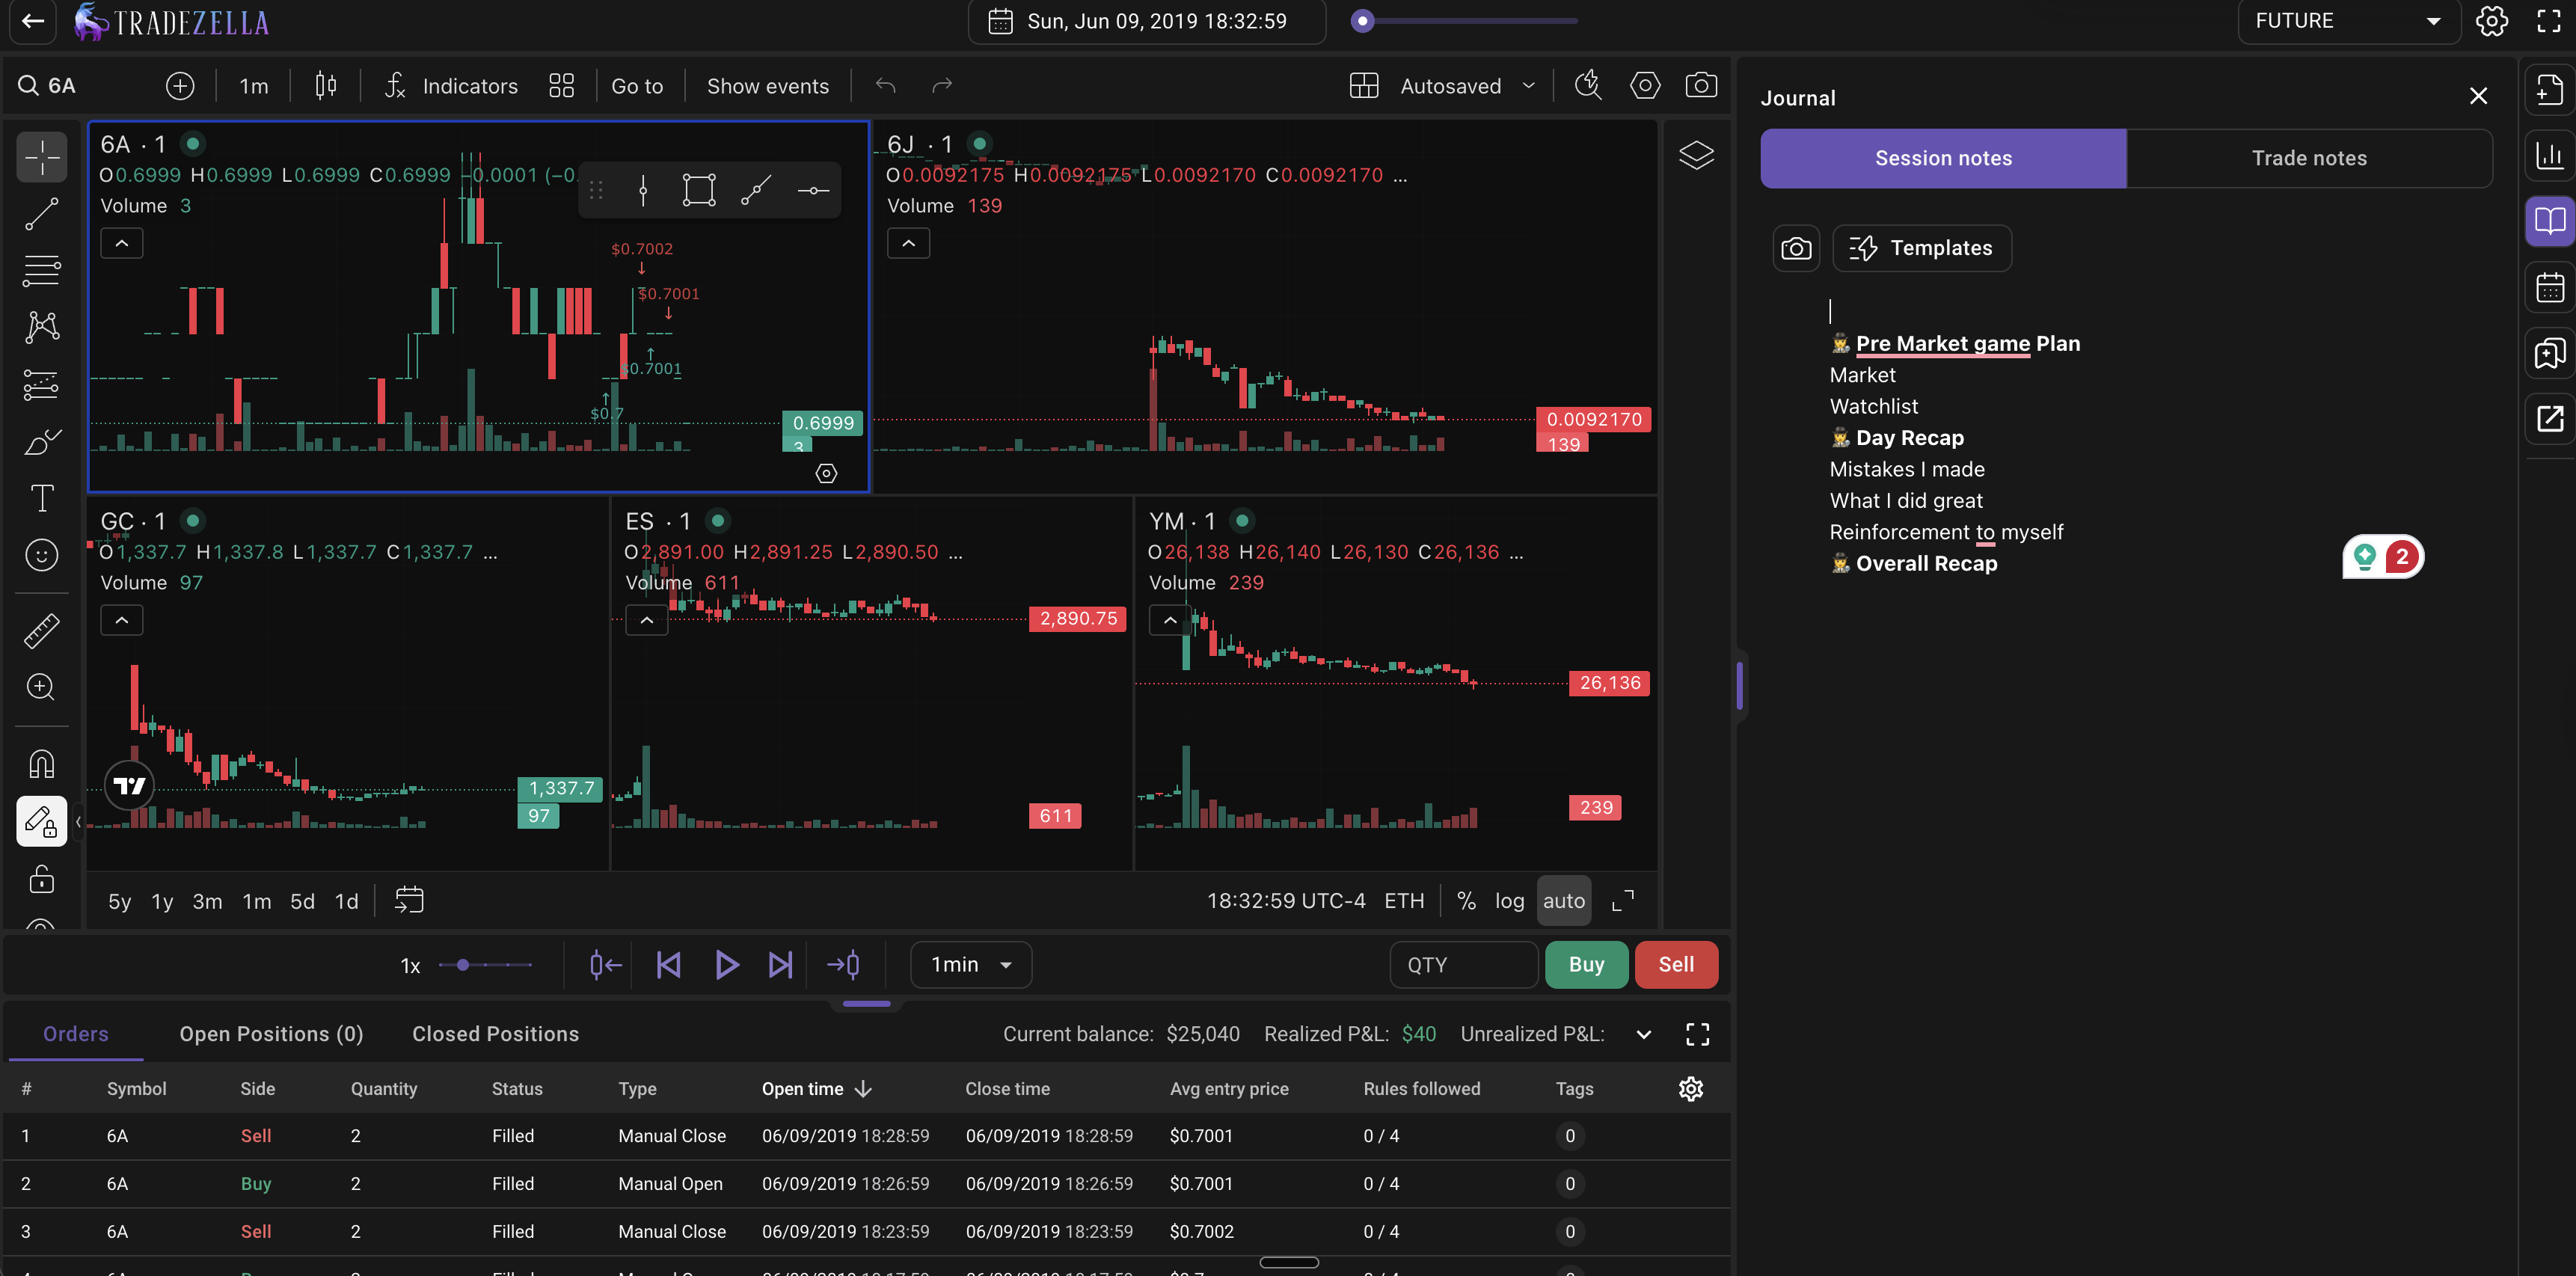
Plain English (no code). You describe your strategy the way you would explain it to another trader: "Enter long when the 9 EMA crosses above the 21 EMA and RSI is below 30, with a stop at 1.5 ATR below entry and a target of 2R." The platform translates this into executable logic. TradeZella uses this approach for automated backtesting, with pre-built templates for ICT, Opening Range Breakout, trend following, and mean reversion strategies. Learning curve: minutes. Time to first test: 5 to 10 minutes.
TradeZella Automated Backtesting
Visual strategy builders. You drag and drop conditions into a flowchart or grid. Platforms like TrendSpider use this approach. Moderate flexibility, moderate learning curve. Time to first test: 1 to 3 hours.
Scripting languages. You write conditional logic in a platform-specific language: Pine Script (TradingView), NinjaScript (NinjaTrader), MQL5 (MetaTrader 5). These are powerful but require learning syntax, debugging code, and understanding programming concepts. Time to first test: 4 to 20 hours of learning, then 1 to 4 hours per strategy.
Full programming. You write strategies in Python (QuantConnect, Backtrader), C++ (custom engines), or R. Maximum flexibility and control. Time to first test: weeks to months, depending on programming background.
Here is the math that matters. If you are a discretionary trader testing a breakout strategy, the plain English approach gets you results in 10 minutes. The same test in Pine Script takes 4 to 6 hours, including the time spent debugging a misplaced comma or an incorrect variable type. Over a month of testing 10 to 15 variations, that gap compounds to 60+ hours of wasted time. On a $50,000 account where your time is worth $50/hour, that is $3,000 in opportunity cost before you even place a live trade.
The question to ask: can I define and test my strategy in under 30 minutes, or do I need to learn a programming language first? If you are a quantitative trader who already writes Python, full programming is the right choice. If you are a discretionary trader who wants to validate setups, plain English or visual builders make more sense. For a full breakdown, read the guide on manual vs automated backtesting or what is automated backtesting.
Traders who already backtest using journal data without any code should also read the guide on backtesting without code, which covers journal-based validation methods.
Factor 2: How Good Is the Historical Data?
Historical data is the raw material of every backtest. Bad data produces bad results, and the quality of historical data varies dramatically across platforms. This factor has four dimensions that most traders overlook.
Depth (how many years). A strategy tested across 2 years of a bull market looks profitable until the first correction arrives. Reliable validation requires data that spans multiple market regimes: trending, ranging, volatile, quiet, bull, and bear. TradeZella offers 11+ years of historical data. TradingView varies by plan and instrument. MetaTrader 5 depends on broker data feeds. The minimum for confident testing is 2 to 3 years. Five or more years is better.
Asset coverage. Does the platform support the instruments you actually trade? Some platforms covers forex and limited futures. QuantConnect covers most asset classes but requires coding. TradeZella covers futures (ES, NQ, CL, GC, MES, MNQ, RTY etc), stocks, crypto and forex. If you trade across multiple markets, check coverage before committing.
Granularity. Candle-based data (1-minute, 5-minute, daily) works for most strategies. Tick data captures every price movement and matters for scalping strategies where entry precision within seconds affects results. Most retail platforms use candle data. Institutional platforms offer tick data at higher cost.
Session handling. For futures and forex traders, the distinction between regular trading hours (RTH) and extended trading hours (ETH) matters. A breakout strategy that works during RTH might show false signals in overnight sessions. TradeZella supports both RTH and ETH filtering. Not all platforms do.
Data costs. Some platforms include data in the subscription. Others charge separately. NinjaTrader requires third-party data subscriptions ($15 to $50+/month depending on the feed). TradingView includes data on paid plans but limits historical depth on lower tiers. TradeZella includes 11+ years of data in the subscription with no additional data fees. Add up the total cost, not just the headline subscription price.
Factor 3: Can You See Every Individual Trade?
This is the factor most beginners ignore and most experienced traders consider essential. Trade visibility means seeing every single simulated trade your backtest generates, with full details: entry price, exit price, duration, R-multiple, and outcome.
Some platforms show only aggregate results: a win rate, a profit factor, an equity curve. Those numbers are useful but they hide critical information. A strategy with a 55% win rate and a 1.8 profit factor looks solid in aggregate. But if you inspect the individual trades, you might discover that 80% of the profits came from 3 outlier trades during a single week of unusual volatility. Remove those 3 trades and the strategy is barely breakeven.
Per-trade visibility lets you verify entries and exits visually on the chart. You can see whether the simulated entries match where you would actually enter. You can identify clusters of losing trades that signal specific market conditions where the strategy fails. You can catch data anomalies, like a trade that supposedly entered during a weekend or a gap that created an unrealistic fill.
TradeZella shows every individual trade in both automated and manual backtesting. Each trade appears in a trade log with full details and is visible on the chart with entry and exit markers. TradingView's Pine Script backtester shows trades on chart but has limited trade log functionality. NinjaTrader shows individual trades. MetaTrader 5 shows individual trades. QuantConnect shows individual trades in the trade log.
TradeZella Backtesting Per Trade Stats
On a $50,000 account with $500 risk per trade, the difference matters in concrete terms. A strategy that backtests at +0.35R expectancy might actually be +0.10R once you remove the 5 outlier trades that depended on once-a-year volatility spikes. That is the difference between $175 expected per trade and $50 expected per trade, or $12,500 per year versus $3,500 on 100 trades. You cannot catch this without per-trade visibility.
Factor 4: Does It Connect to Your Live Trading?
This is the factor that separates backtesting tools from backtesting platforms. Most backtesting software exists in isolation: you test a strategy, see the results, and then close the tool. When you go live, you journal on a different platform, track analytics on a spreadsheet, and review performance in yet another tool. The backtesting data never connects to your live data.
Journal integration means your backtesting results and your live trading results exist in the same system, tracked under the same Strategy name, measured with the same metrics, and filterable with the same tools.
Why this matters: the entire point of backtesting is to create a performance benchmark, then compare your live results against it. If your backtest shows a 48% win rate, 1.6 profit factor, and +0.30R expectancy, those become the targets. When you trade the strategy live, you need to know whether your real results match. If the live win rate drops to 35%, something changed: either you are not following your own rules, market conditions shifted, or the backtest was overfitted.
Without journal integration, this comparison requires manual work. You export backtest data from one tool, export live data from your journal, line them up in a spreadsheet, and calculate the gap yourself. On a $50,000 account, this comparison takes 30 to 45 minutes per strategy per month. If you run 3 Strategies, that is 90+ minutes of spreadsheet work every month.
TradeZella is the only platform that combines automated backtesting, manual replay, a trading journal, 50+ analytics reports, and Zella AI analysis in one system. When you define a Strategy for backtesting, that same Strategy carries into your live journal. Your trade review process uses the same tools for both datasets. As you build your trade journal, the backtest data is already there for comparison.
TradingView has no integrated journal. NinjaTrader has no integrated journal. MetaTrader 5 has no integrated journal. QuantConnect has no integrated journal. FX Replay has basic notes but not a full journal with analytics. Edgewonk has a journal but no backtesting engine.
For traders using AI-powered journals, this integration becomes even more valuable. Read the guide on AI trading journals to understand how Zella AI leverages both backtest and live data to identify patterns.
TradeZella Journaling Backtesting
Factor 5: Can AI Analyze Your Results?
This factor did not exist two years ago. In 2026, the best backtesting platforms use AI to analyze results beyond what summary statistics show.
Raw backtest results give you numbers: win rate, profit factor, expectancy, drawdown. Those numbers tell you whether the strategy worked. They do not tell you why it worked, when it worked best, or where it breaks down.
AI analysis answers those deeper questions. TradeZella's Zella AI analyzes backtest results and identifies patterns human review would miss. It flags time-of-day performance variations (the strategy works in the morning but loses money after 2 PM). It detects day-of-week patterns. It identifies conditions where the strategy outperforms or underperforms its average. It compares backtest results to your live trading results and flags execution gaps.
This is what makes Zella AI different from general-purpose AI like ChatGPT. ChatGPT does not have your data. It cannot compare your Tuesday results to your Thursday results or tell you that your ES breakout strategy loses money during the first 30 minutes of the session. Zella AI works on your actual trade data, remembers your Strategies and preferences across sessions, and has trading-specific skills (ICT, order flow, prop firm rules). For the full breakdown, read the guide on AI trading tools and AI trade analysis.
Zella AI
Most competing platforms have no AI analysis of backtest results. TradingView has no AI analysis. NinjaTrader has no AI analysis. FX Replay has basic AI queries on the Pro plan only, with no memory and no autonomous agents. QuantConnect has community-built analytics but no integrated AI.
Factor 6: What Is the Total Cost?
The subscription price is not the total cost. Most traders underestimate what backtesting software actually costs because they ignore three hidden expenses.
Data fees. NinjaTrader requires third-party data subscriptions for real-time and historical data: $15 to $50+/month depending on the feed and asset classes. That adds $180 to $600 per year on top of the platform cost. TradingView includes data on paid plans but historical depth varies by tier. TradeZella includes 11+ years of historical data in the subscription with no additional data fees.
Add-on costs. Some platforms charge for indicators, additional features, or higher-tier data. Pine Script is free on TradingView, but advanced features like more alerts, deeper historical data, or faster server-side execution require Premium+ plans ($24.95 to $49.95/month). NinjaTrader's base platform is free, but the full feature set requires a license ($99/quarter or $999 lifetime) plus data fees plus third-party indicators.
The hidden cost: manual work time. This is the biggest expense most traders never calculate. If your backtesting platform does not integrate with your journal, you spend time on CSV exports, spreadsheet formatting, manual comparisons, and re-entering data across tools. If that manual work costs 30 minutes per day and your time is worth $50/hour, that is $25/day, $750/month, or $9,000/year in opportunity cost.
The total cost calculation on a $50,000 account:
Platform A (coding-required, no journal): $50/month subscription + $30/month data fees + $25/month indicator add-ons + $750/month manual work time = $855/month total
Platform B (integrated backtesting + journal + analytics): $49/month subscription + $0 data fees + $0 add-ons + $0 manual work (automated) = $49/month total
The "cheaper" platform costs 17x more when you count the time. This is why evaluating total cost of ownership matters more than comparing subscription prices. When you factor in TradeZella's free trading calculators (Position Size, Risk/Reward, Drawdown Recovery, Monte Carlo), the value comparison gets even wider.
Ask yourself: what is my trading expectancy per hour of work? If the cheaper platform requires 15 extra hours per month of manual data management, and your expected hourly value is $50, you are losing $750/month to save $20/month on a subscription.
What Are the Most Common Mistakes When Choosing Backtesting Software?
After auditing dozens of backtesting platforms and talking to thousands of traders, these are the 5 mistakes that waste the most money and time.
Mistake 1: Choosing based on charting quality. Charts are not backtesting. TradingView has the best charts in the industry, but its backtesting engine (Pine Script) requires coding, has limited per-trade analytics, and integrates with no journal. Beautiful charts do not validate strategies. A platform with average charts but excellent backtesting, journaling, and analytics produces better trading results than a platform with stunning charts and mediocre everything else.
Mistake 2: Ignoring the journal gap. Most traders backtest on one platform and journal on another (or do not journal at all). This creates a disconnect where backtest expectations never get compared to live reality. When the strategy underperforms live, you cannot diagnose whether the problem is execution, market conditions, or an overfitted backtest. The journal gap costs traders thousands of dollars in undiagnosed problems.
Mistake 3: Overpaying for data you do not need. Institutional-grade tick data costs $50 to $200+/month. Most retail strategies using 1-minute or 5-minute candles do not need tick data. A swing trader using daily candles definitely does not need it. Match the data resolution to your strategy timeframe.
Mistake 4: Picking coding-required platforms when you are discretionary. If your strategy involves "this looks like a good breakout to me," writing it in Pine Script is nearly impossible. Discretionary elements (context reads, pattern recognition, market feel) cannot be fully codified. Discretionary traders are better served by plain English rules for the objective parts and manual replay for the discretionary parts.
Mistake 5: Not testing forward testing capabilities. Traders evaluate the backtesting engine and forget to check whether the platform also supports replay and forward testing. Backtesting proves the strategy works in theory. Forward testing proves you can execute it in practice. If the platform only does one, you need a second tool for the other, which adds cost and creates data silos.
The 6-Point Evaluation Checklist
Use this checklist when comparing any backtesting platform. Score each factor 1 to 3 (1 = poor, 2 = adequate, 3 = excellent) and total the score. The platform with the highest total is your best fit.
Rule Definition. Can I define and test a strategy in under 30 minutes without learning a programming language?
Data Quality. Does the platform offer 3+ years of historical data for the instruments I trade, with session filtering (RTH/ETH)?
Trade Visibility. Can I see every individual trade with entry, exit, duration, and R-multiple?
Journal Integration. Do backtesting results and live trading results exist in the same platform under the same Strategy name?
AI Analysis. Can AI analyze results, identify patterns, and compare backtest to live performance.
Total Cost. What is the all-in monthly cost including data fees, add-ons, and the time cost of manual work?
TradeZella scores highest across most factors for retail traders: plain English rules (Factor 1), 11+ years of included data (Factor 2), every individual trade visible (Factor 3), integrated journal with 50+ reports (Factor 4), 3 replay modes plus automated backtesting (Factor 5), Zella AI analysis (Factor 6), Prop Firm Sync and Challenge widget (Factor 7), and all-inclusive pricing with no data fees (Factor 8).
Where TradingView scores higher: charting quality and community ecosystem. If you primarily need a charting platform with backtesting as a secondary feature, and you are comfortable writing Pine Script, TradingView is a strong choice. Where NinjaTrader scores higher: advanced order simulation during replay and direct connection to specific data feeds. If you need tick-level precision for scalping strategies, NinjaTrader's replay engine is excellent.
The honest recommendation: most discretionary retail traders get the most value from a platform that integrates backtesting with journaling and analytics, because the journal gap (Mistake 2) destroys more trading improvement than any other single factor.
Key Takeaways
Rule definition method is the first filter. If you need to learn a programming language before testing your first strategy, most of the platform's value is locked behind a learning curve you may never complete. Plain English rules remove this barrier.
Data quality has four dimensions. Depth (years), asset coverage, granularity (candles vs ticks), and session handling (RTH vs ETH). Check all four, not just depth.
Trade visibility separates real analysis from guesswork. Aggregate statistics hide problems. Per-trade review reveals outliers, regime-dependent performance, and data anomalies.
Journal integration is the most underrated factor. Backtesting without live comparison is theory without validation. The platform that connects both datasets gives you the clearest path to improvement.
AI analysis is the new differentiator. Zella AI identifies patterns in backtest results that summary statistics miss, including time-of-day edges, regime sensitivity, and execution gaps.
Total cost of ownership includes your time. A $20/month platform that requires 15 hours of manual work per month is not cheaper than a $49/month platform that automates everything.
Frequently Asked Questions
What is the most important feature in backtesting software?
Journal integration. Most traders focus on backtesting power, but the ability to compare backtest results to live trading results in the same platform determines whether backtesting actually improves your trading. Without this comparison, you have no way to know if your live execution matches your tested strategy. A backtest that shows a 1.6 profit factor means nothing if your live trading produces a 0.9 profit factor and you cannot diagnose why. TradeZella is the only platform that integrates automated backtesting, manual replay, a full trading journal, and 50+ analytics reports in one system.
Do I need coding skills to backtest?
No. TradeZella uses plain English rules for automated backtesting. You describe your strategy the way you would explain it to another trader: entry conditions, exit conditions, stop loss, and profit target. The platform translates this into executable logic and runs it across 11+ years of data. Pre-built templates for ICT concepts, Opening Range Breakout, trend following, and mean reversion strategies provide starting points you can customize. Coding is only necessary if you use platforms like TradingView (Pine Script), NinjaTrader (NinjaScript), MetaTrader (MQL5), or QuantConnect (Python/C#).
How much should I spend on backtesting software?
Calculate the total cost of ownership, not just the subscription price. A platform that costs $20/month but requires separate data feeds ($30/month), add-on indicators ($25/month), and 15 hours of manual work per month (worth $750 at $50/hour) actually costs $825/month. A platform like TradeZella at $49/month with included data, no add-ons, and automated journal integration costs $49/month total. For a $50,000 trading account, the right backtesting platform should pay for itself within the first month through better strategy validation and fewer avoidable losses.
Should I use the same platform for backtesting and journaling?
Yes. Using separate platforms creates a data gap where backtest expectations never get compared to live reality. When the strategy underperforms live, you cannot determine whether the issue is execution (you are not following your own rules), market conditions (the regime changed), or an overfitted backtest (the strategy never had a real edge). An integrated platform like TradeZella tracks the same Strategy name across backtesting and live trading, making this comparison automatic. You see the gap immediately instead of discovering it months later after significant losses.
How many years of data do I need for backtesting?
A minimum of 2 to 3 years that includes different market regimes: trending, ranging, volatile, quiet, bull, and bear. Five or more years is better because it captures more regime transitions and produces higher sample sizes. A strategy tested across 6 months of a single market condition (like a strong bull run) will almost certainly underperform when conditions change. TradeZella offers 11+ years of historical data for futures, stocks, and forex, which covers multiple full market cycles including the 2020 crash, 2021 bull run, 2022 bear market, and subsequent recovery.
What is the difference between backtesting and paper trading?
Backtesting runs a strategy against historical data to determine whether it would have been profitable. All trades are simulated after the fact. Paper trading (also called forward testing or demo trading) means trading the strategy in real time or simulated real time without risking capital. Backtesting tests the strategy. Paper trading tests the trader. Both are necessary for complete validation. The ideal pipeline is: automated backtest (statistical proof), manual replay (execution practice), paper trading (live market readiness), then graduated live sizing at 50%, 75%, and 100% of target position size. TradeZella supports all stages of this pipeline in one platform.