TradingView Backtesting vs TradeZella: Pine Script vs Plain English Rules
TradingView Backtesting vs TradeZella: Pine Script vs Plain English Rules
TradingView backtesting requires Pine Script coding. TradeZella lets you write rules in plain English and runs them across years of market data in seconds. This head-to-head comparison covers rule definition, journal integration, AI analysis, prop firm support, replay, and pricing so you can decide which platform fits your backtesting workflow.
class SampleComponent extends React.Component {
  // using the experimental public class field syntax below. We can also attach
  // the contextType to the current class
  static contextType = ColorContext;
  render() {
    return <Button color={this.color} />
  }
}
Last Updated: July 13, 2026
TradingView and TradeZella are two of the most popular platforms for backtesting trading strategies, but they approach the problem from opposite directions. TradingView requires Pine Script, a proprietary coding language, to build and run strategy backtests on its charts. TradeZella lets you write trading rules in plain English and runs them across years of historical market data in seconds, with every individual trade visible in a full analytics dashboard. Both platforms test whether a strategy has an edge. The difference is how you define the rules, what happens to the results, and how the backtest connects to your actual trading. This article compares both platforms across every dimension that matters for backtesting trading strategies, from rule definition to journal integration to prop firm support. If you are evaluating automated backtesting options, this is the comparison you need.
TL;DR
TradingView has the better charting platform and a massive community of shared scripts. TradeZella has the better backtesting workflow for traders who do not code: plain English rules, full journal integration, the ability to inspect and tag every individual trade, AI analysis from Zella AI, and prop firm support. The sharpest difference is what you can do with the results: TradingView gives you a trade list and chart markers, while TradeZella lets you open, tag, filter, and replay every individual trade with the setup context on the chart. Most serious traders use both: TradingView for charting, TradeZella for backtesting, journaling, and analytics.
How Do They Handle Rule Definition?
This is the single biggest difference between the two platforms, and the reason most traders choose one over the other for backtesting.
TradingView: Pine Script
TradingView backtesting runs on Pine Script, a domain-specific programming language built for the platform. To backtest a simple EMA crossover strategy, you write something like this:
That is a basic example. Real strategies with stop losses, position sizing, time filters, and multiple conditions can easily run 50 to 200+ lines. You need to understand variables, conditional logic, built-in functions, and Pine Script syntax. For a trader who already knows Python or JavaScript, learning Pine Script takes a few days to a week. For a trader with zero coding experience, expect two to four weeks of dedicated study before you can write and debug a strategy that works reliably.
The Pine Script reference manual is extensive, and TradingView's community has published thousands of open-source scripts. You can find pre-built strategies, copy them, and modify the parameters. This is TradingView's biggest backtesting advantage: the community library. If someone has already coded an ICT strategy, an Opening Range Breakout, or a VWAP mean reversion, you can test it in minutes without writing a line of code yourself. The limitation is that modifying someone else's script still requires understanding the code.
TradeZella: Plain English
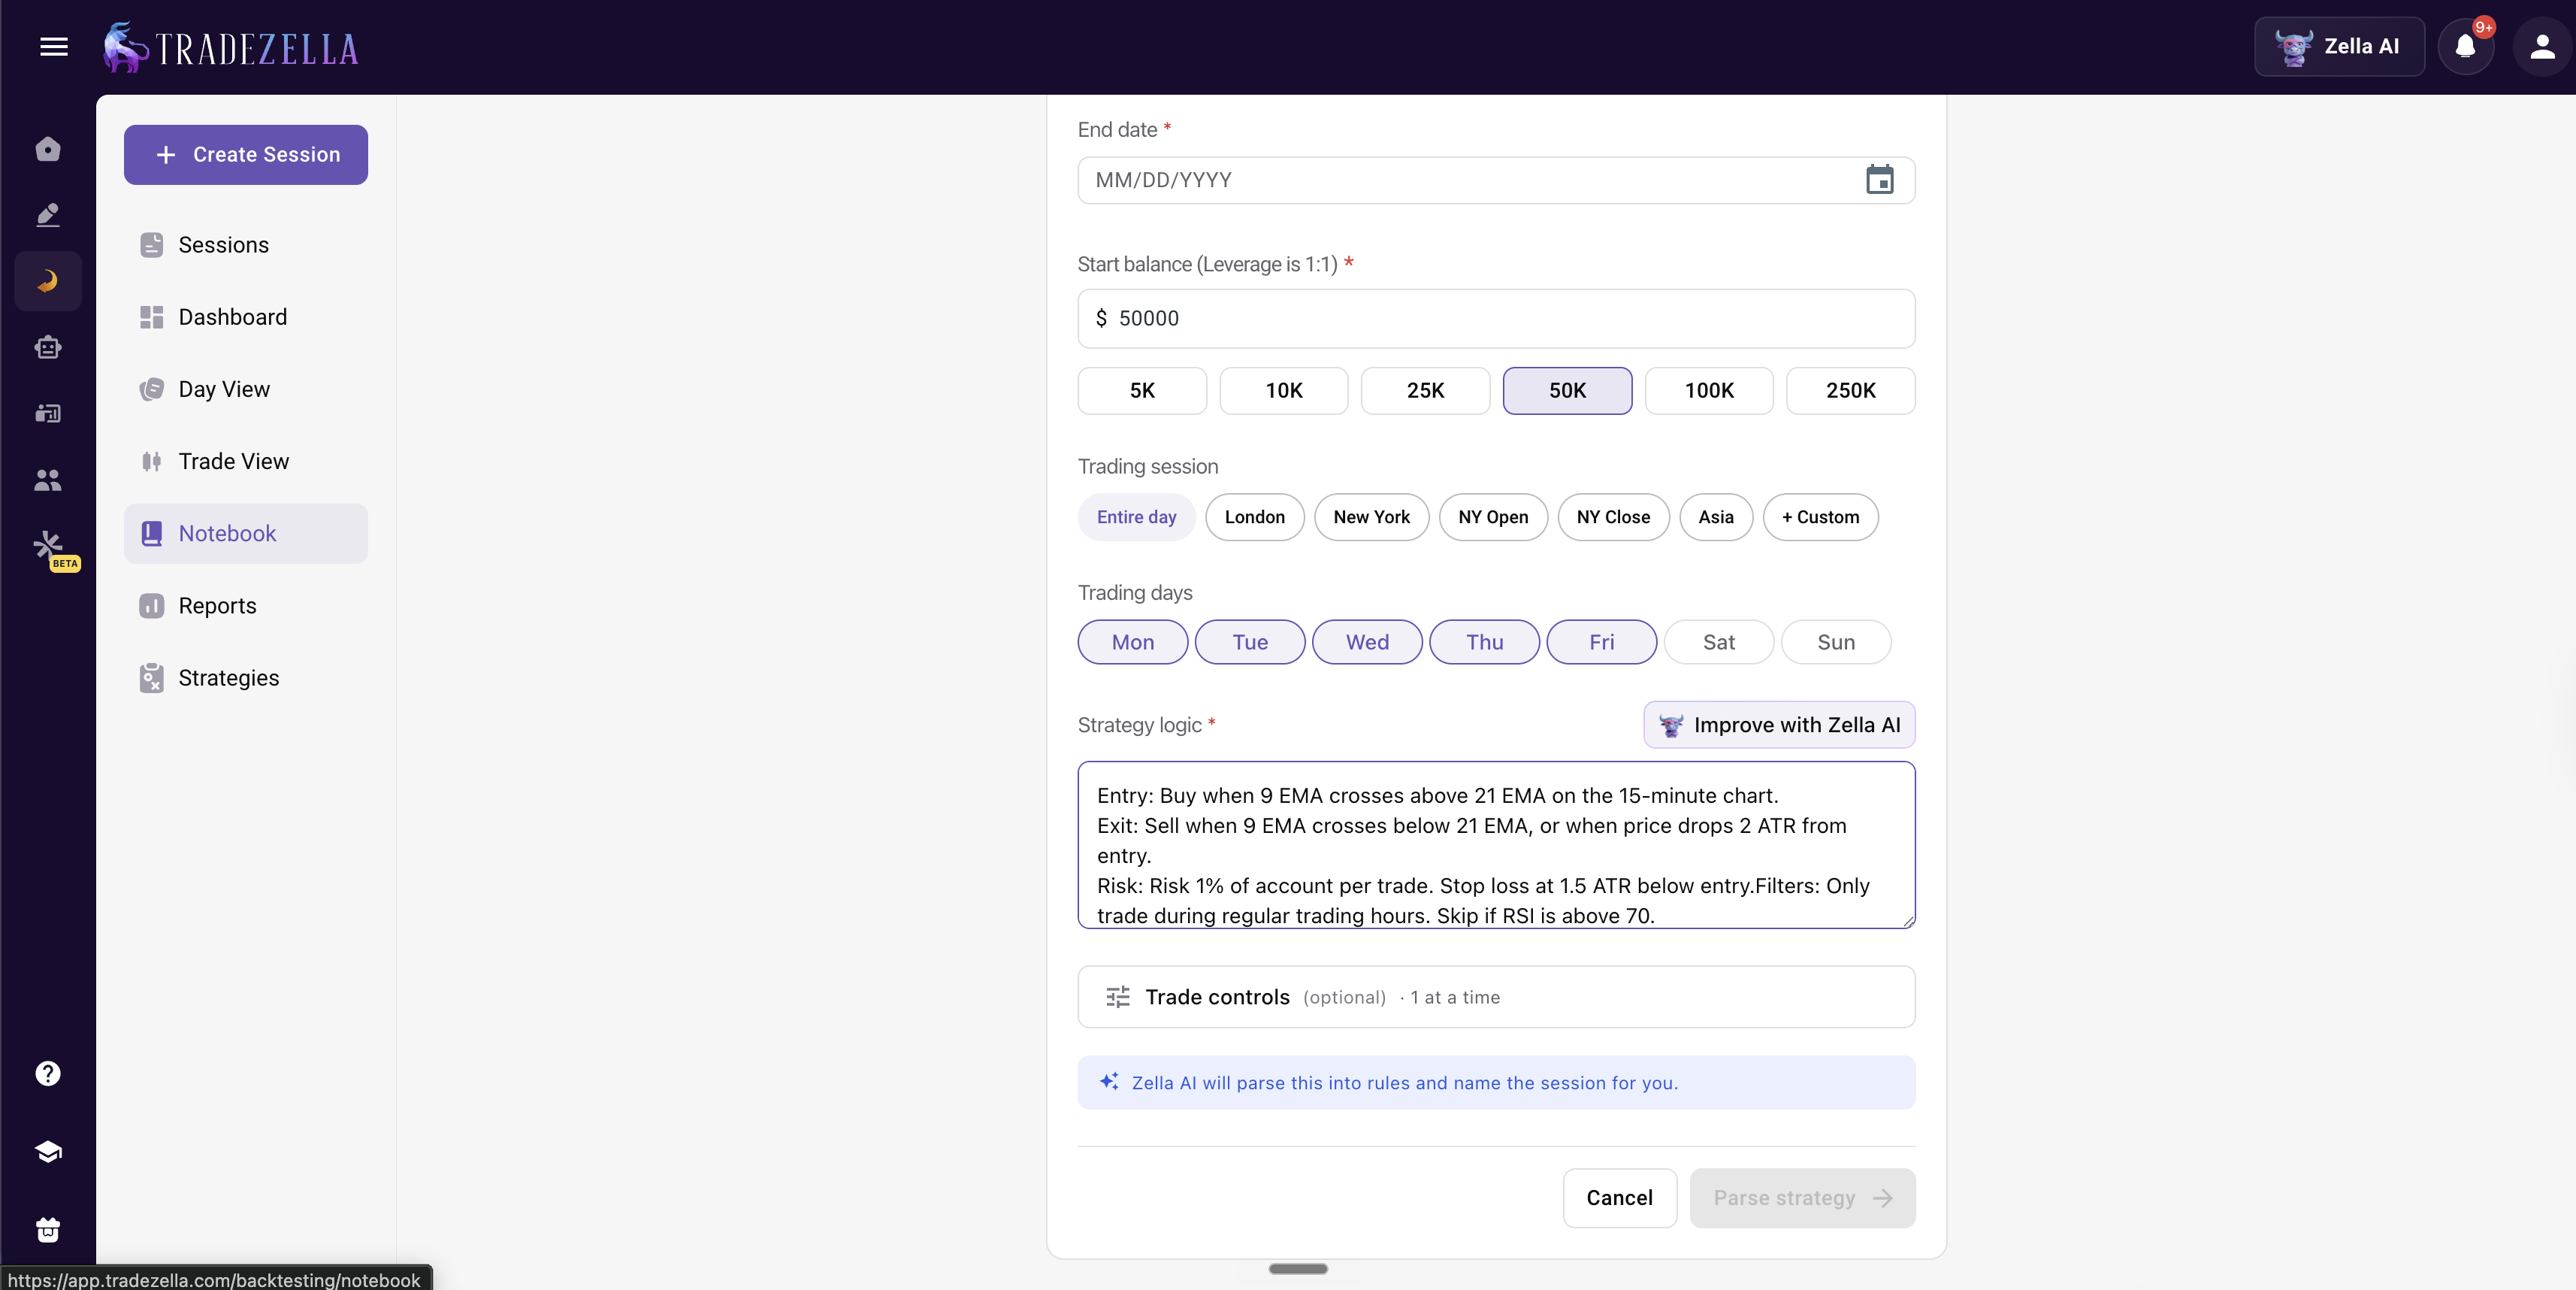
TradeZella's automated backtesting uses plain English rules. The same EMA crossover strategy looks like this:
Entry: Buy when 9 EMA crosses above 21 EMA on the 15-minute chart. Exit: Sell when 9 EMA crosses below 21 EMA, or when price drops 2 ATR from entry. Risk: Risk 1% of account per trade. Stop loss at 1.5 ATR below entry. Filters: Only trade during regular trading hours. Skip if RSI is above 70.
TradeZella Automated Backtesting
No coding. No syntax errors. No debugging. You describe what you want in the same language you use to explain the strategy to another trader. The engine translates your rules into executable conditions and runs them across years of historical data. For a deeper look at how this works, see our guide on what is automated backtesting.
TradeZella also includes pre-built templates for popular strategies, including ICT concepts (FVGs, liquidity sweeps, breaker blocks), Opening Range Breakout, trend following, and mean reversion. You can run a template as-is, then customize the parameters and re-run in seconds. For a complete product walkthrough, see backtest with TradeZella.
The Learning Curve Gap
On a $50,000 account with $500 risk per trade, the learning curve is not just an inconvenience. It is a cost. Every week you spend learning Pine Script is a week you are not validating your strategy. If your strategy has a positive expectancy of +0.25R per trade and you take 5 trades per week, four weeks of learning costs you roughly $2,500 in expected profit (20 trades at $125 average). That does not mean learning Pine Script is wrong. It means the learning curve has a real dollar price that traders should factor into their decision.
Feature
TradingView
TradeZella
Rule Definition
Pine Script (coding)
Plain English (no code)
Learning Curve
Weeks to months
Minutes
Journal Integration
None
Full (300+ Reports)
Live Trade Import
None
500+ Brokers
AI Analysis
None
Zella AI Agents
Trade Replay
Bar Replay (paid)
3 Replay Modes
Prop Firm Support
None
Prop Firm Sync
Charting
Industry-Leading
Not a charting platform
Pricing
Free-$59.95/mo
$35-$99/mo
How Do the Backtesting Results Compare?
TradingView Results
TradingView's Strategy Tester displays a performance summary (net profit, total trades, percent profitable, profit factor, max drawdown), a List of Trades tab, and an equity curve. The List of Trades shows each individual trade with its entry and exit, date and time, price, position size, and net profit and loss, and entries and exits are plotted on the chart. The metrics are solid for a quick read. Where it stops: you cannot open a trade to replay how the setup formed, TradingView does not display R-multiples or calculate expectancy natively, and you cannot tag trades or filter by time of day, session, or setup type. For any of that, you export the data and analyze it elsewhere.
TradeZella Results
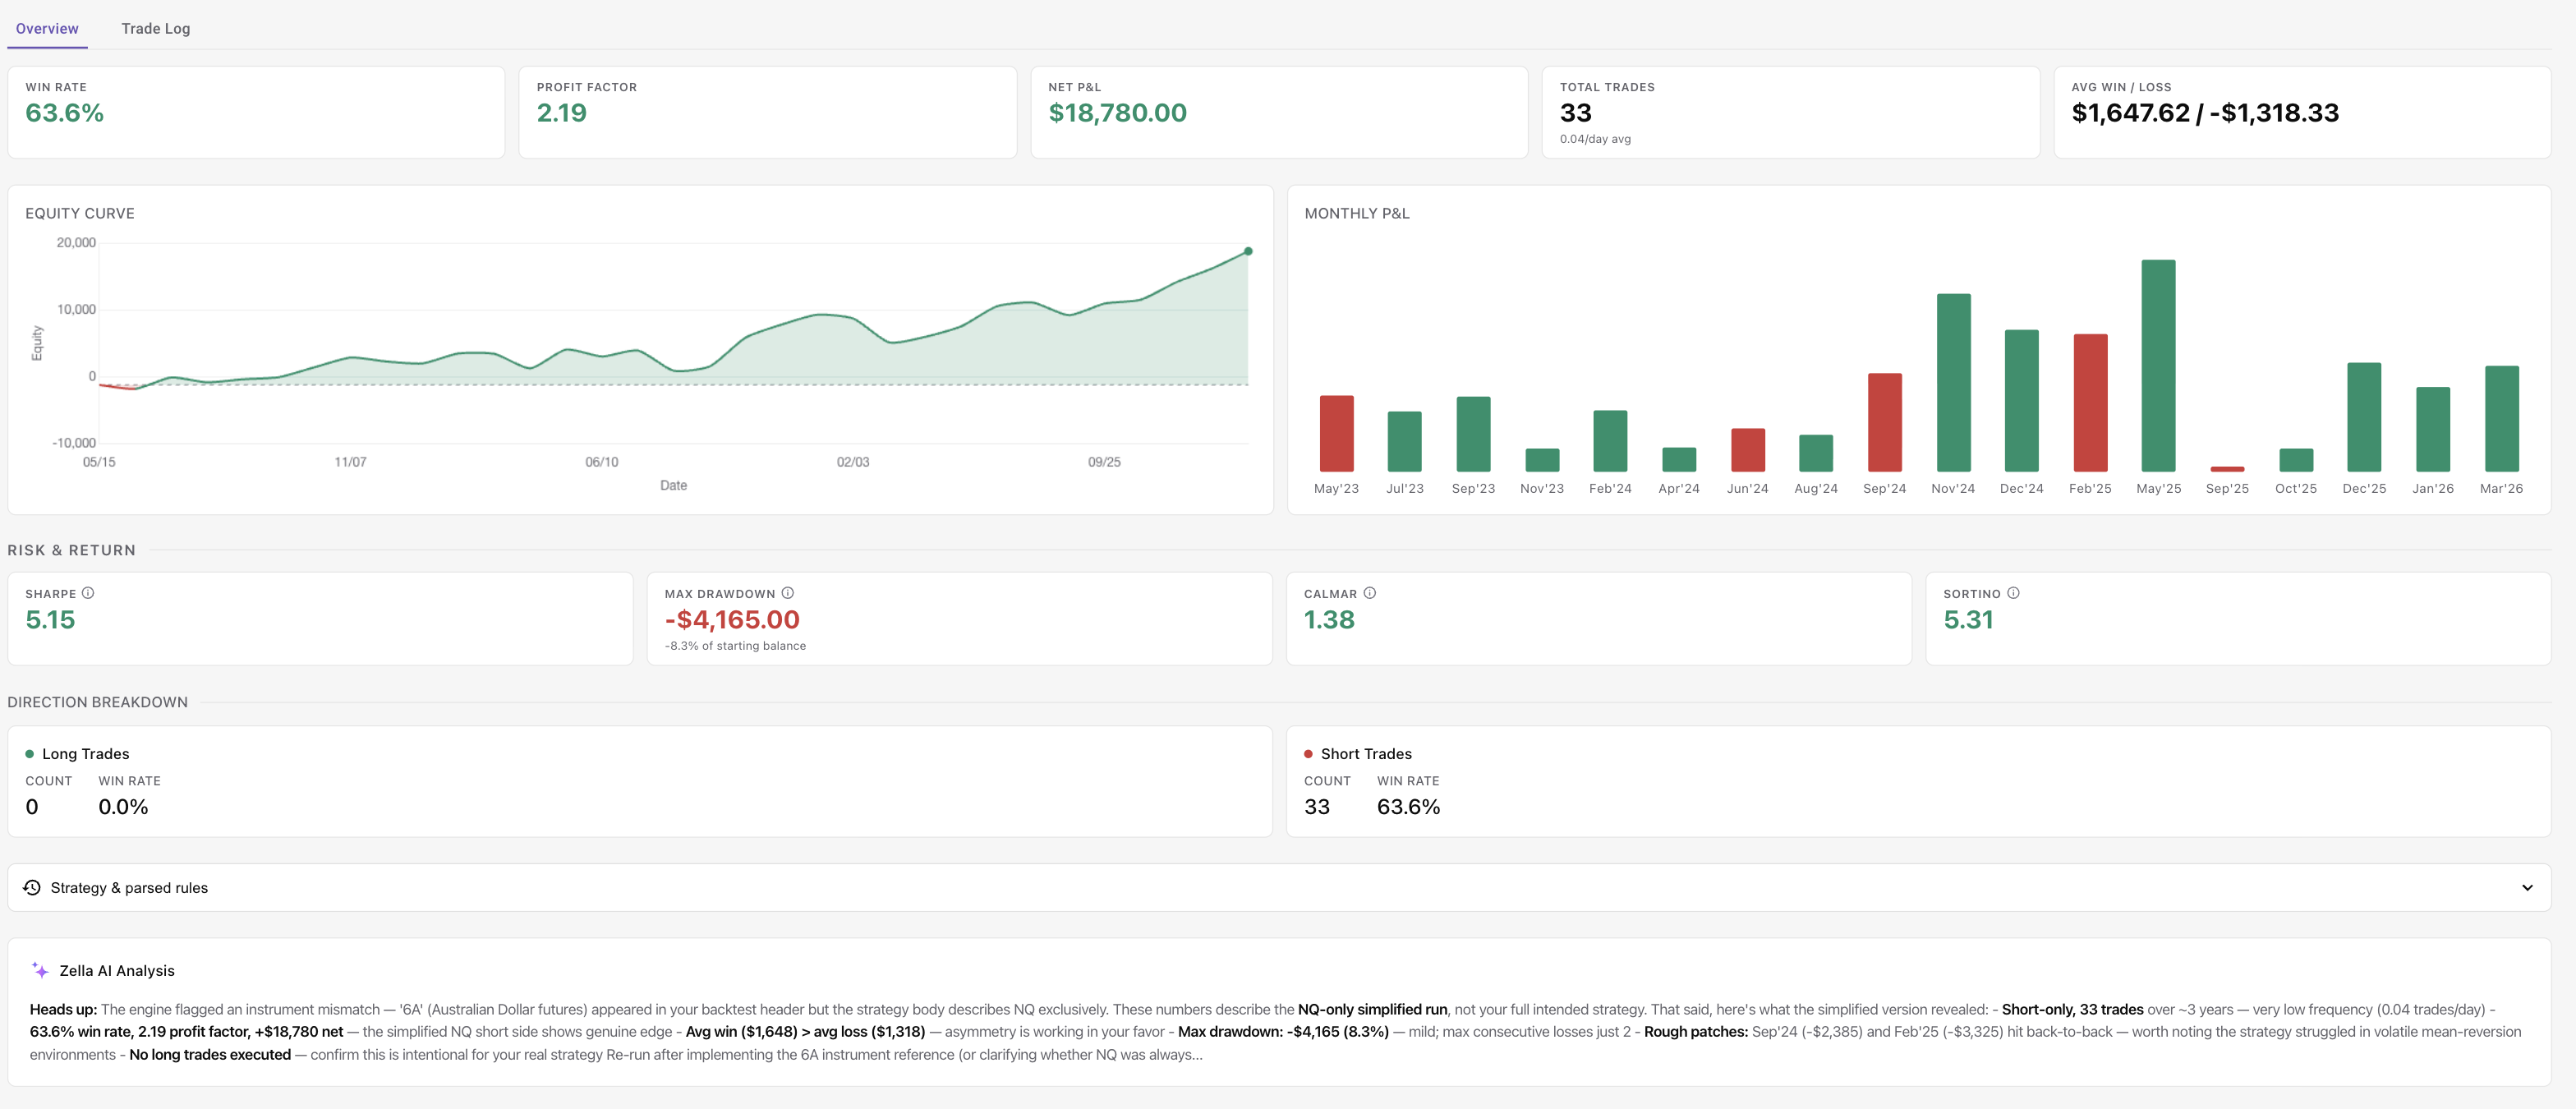
When the backtest finishes, the Overview gives you the headline stats, win rate, profit factor, net P&L, average win versus loss, an equity curve, and risk metrics like Sharpe, Sortino, and max drawdown, plus a Zella AI analysis that reads the run in plain English.
From there, every backtested trade opens in the Trade View as a full journal entry: you open any trade to see its chart with the setup drawn, tag it by setup or mistake, and review columns like duration, ticks, Zella Insights, and the Zella Score. You can filter and slice those trades by date, tag, or session in the same analytics reports you use for your live trading, so if you notice the strategy performs better before 11:00 AM, you can confirm it and then re-run with a modified prompt to test that window. That whole loop, run, review every trade, refine, is what TradingView cannot do.
TradeZella Automatic Backtesting Stats with Zella AI Analysis
Can You Inspect Every Individual Trade?
Both platforms give you a list of the trades a backtest took. The difference is what you can do with each one, and this is where TradeZella separates itself.
On TradingView, the List of Trades is a table, and entries and exits are marked on the chart. You can see where a trade opened and closed and its profit and loss, but you cannot open a single trade to study how the setup formed, and you cannot tag it, score it in R-multiples, or filter the set by session or setup. It is a static record.
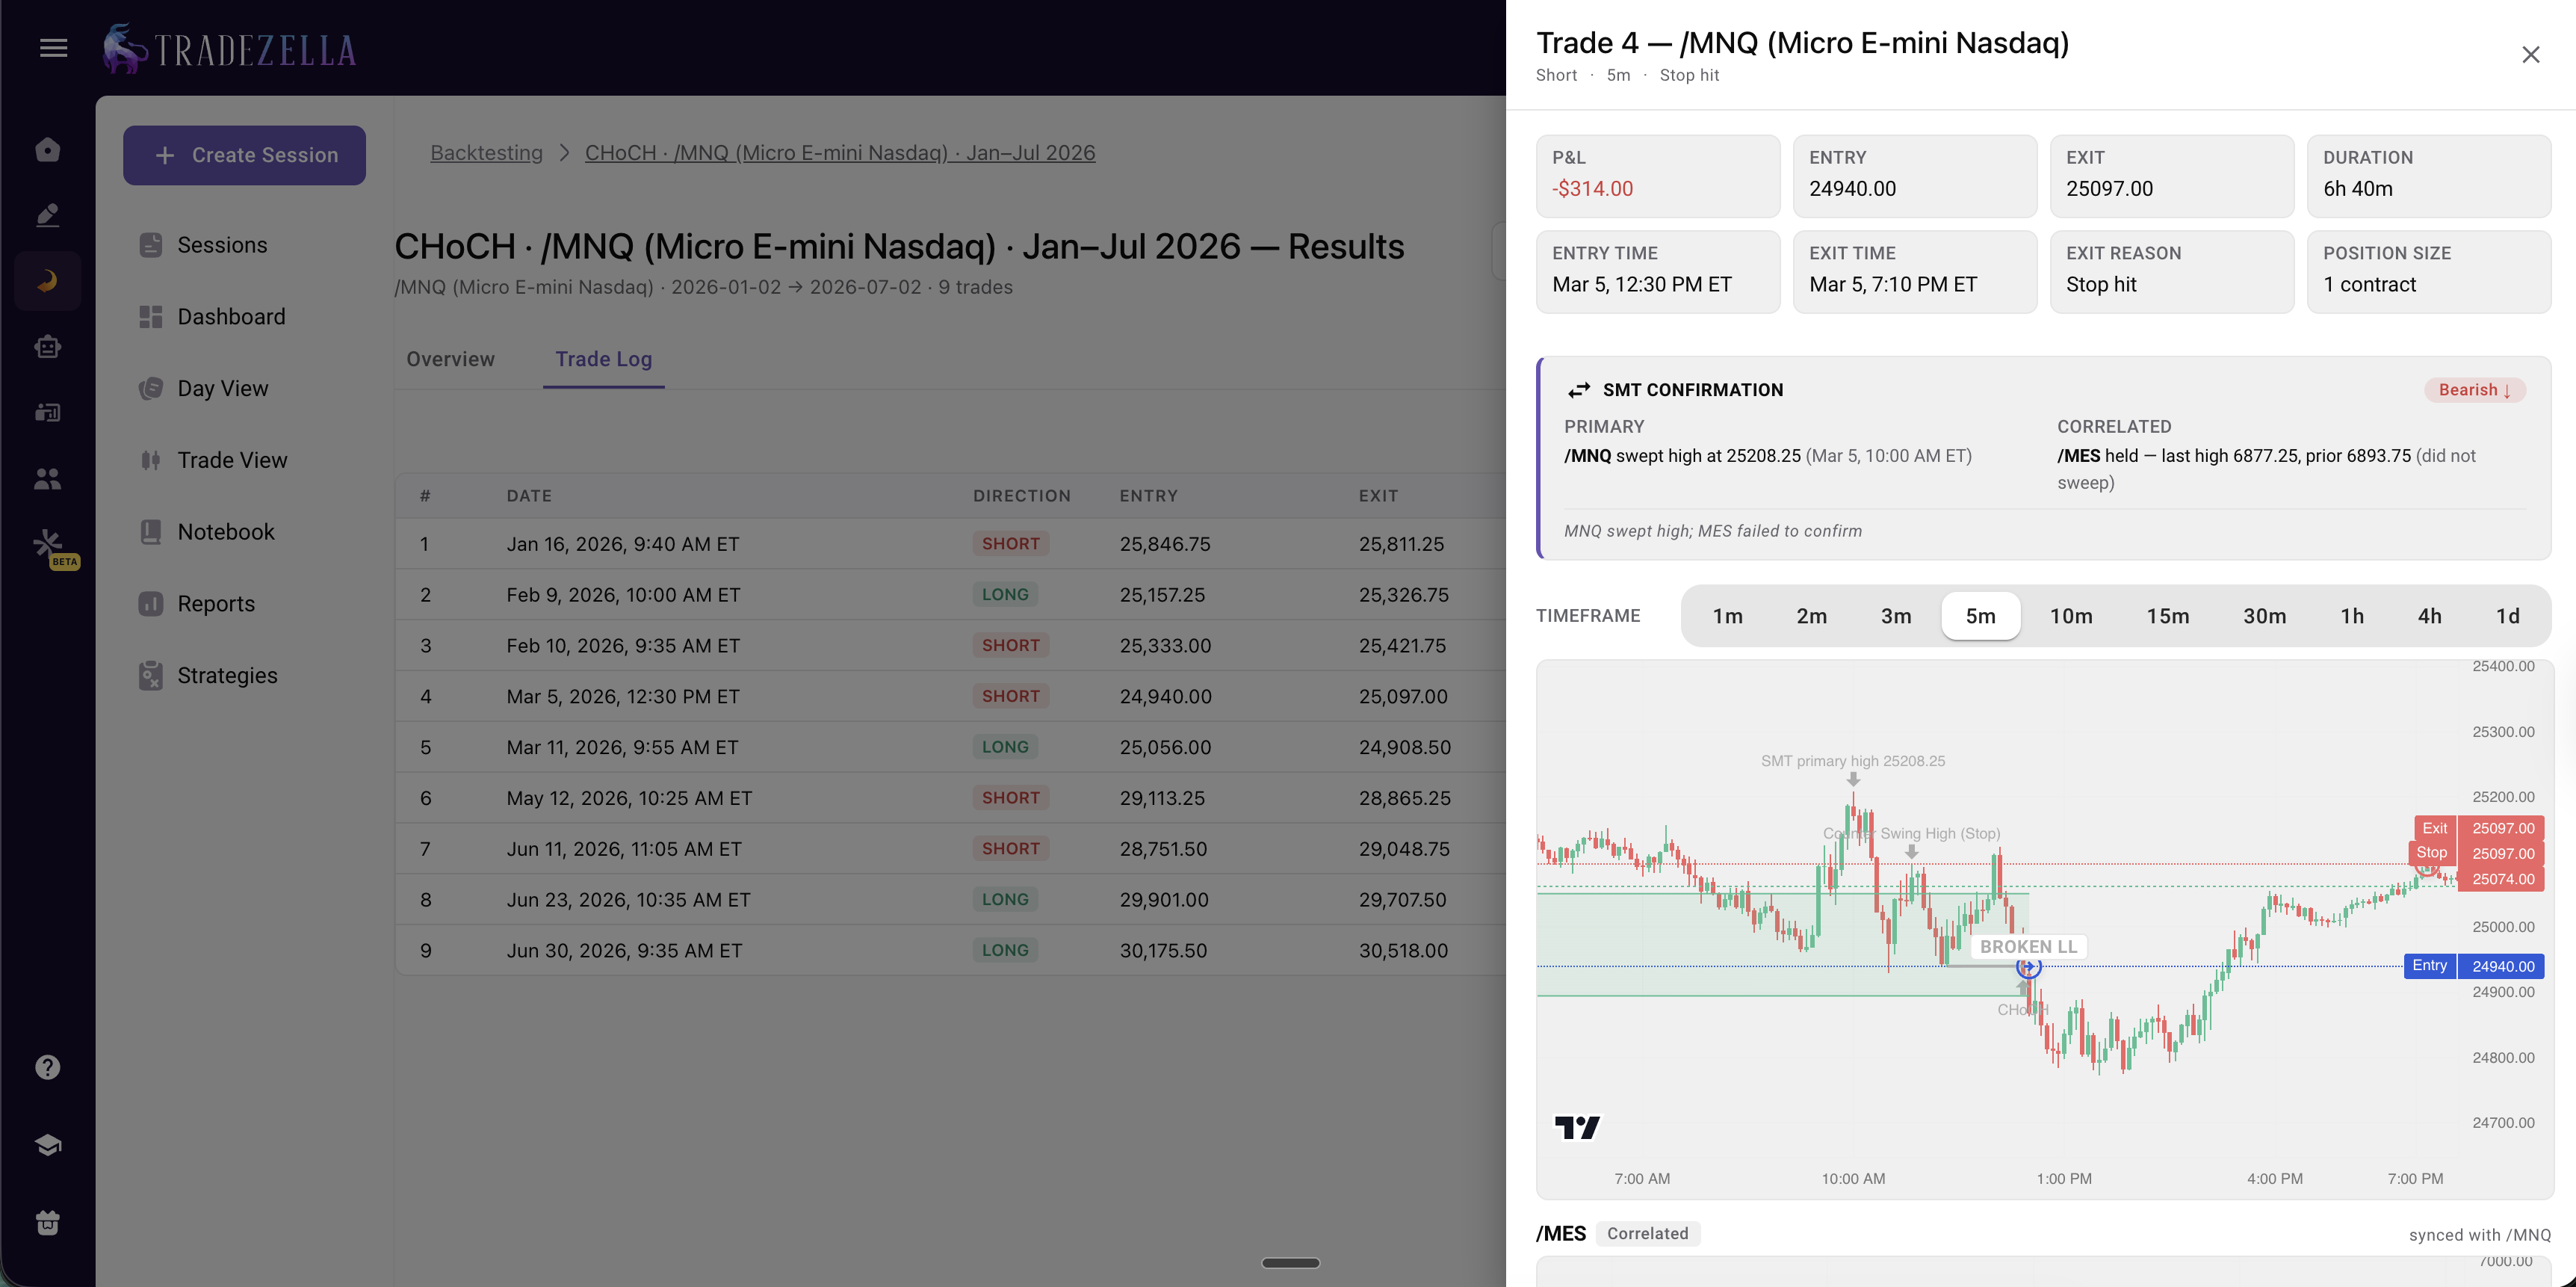
In TradeZella, every backtested trade is a reviewable journal entry. If the engine took 100 trades, you can open any one and see it on the chart with the setup the AI drew, the Fair Value Gap, the liquidity sweep, the market structure shift (CHoCH), and even SMT confirmation across a correlated instrument, then tag it by setup, quality, or mistake. You review each backtest trade the same way you would review a live trade, and because the seconds timeframe lets the candles play out, you can watch how the trade developed instead of guessing from a row in a table.
This matters because summary statistics hide problems. A 1.5 profit factor can come from 90 small winners and 10 catastrophic losers, or from a few unrepeatable fills on illiquid bars. The only way to know is to inspect the trades, and TradeZella makes that a normal part of the workflow. The same gap applies to NinjaTrader, which returns backtest results without letting you review each trade this way.
TradeZella Automatic Backtesting Per Trade Analysis
What Happens After the Backtest?
This is where the two platforms diverge most dramatically. TradingView's backtesting is self-contained. TradeZella's backtesting is the starting point of a complete workflow.
Journal Integration
TradingView has no trading journal. Zero. You can run a Pine Script backtest, see the results, and then you are on your own. There is no way to tag trades, add notes, compare backtest results to live performance, or track whether your actual trading matches your backtested expectations. If you want to journal, you need a separate tool.
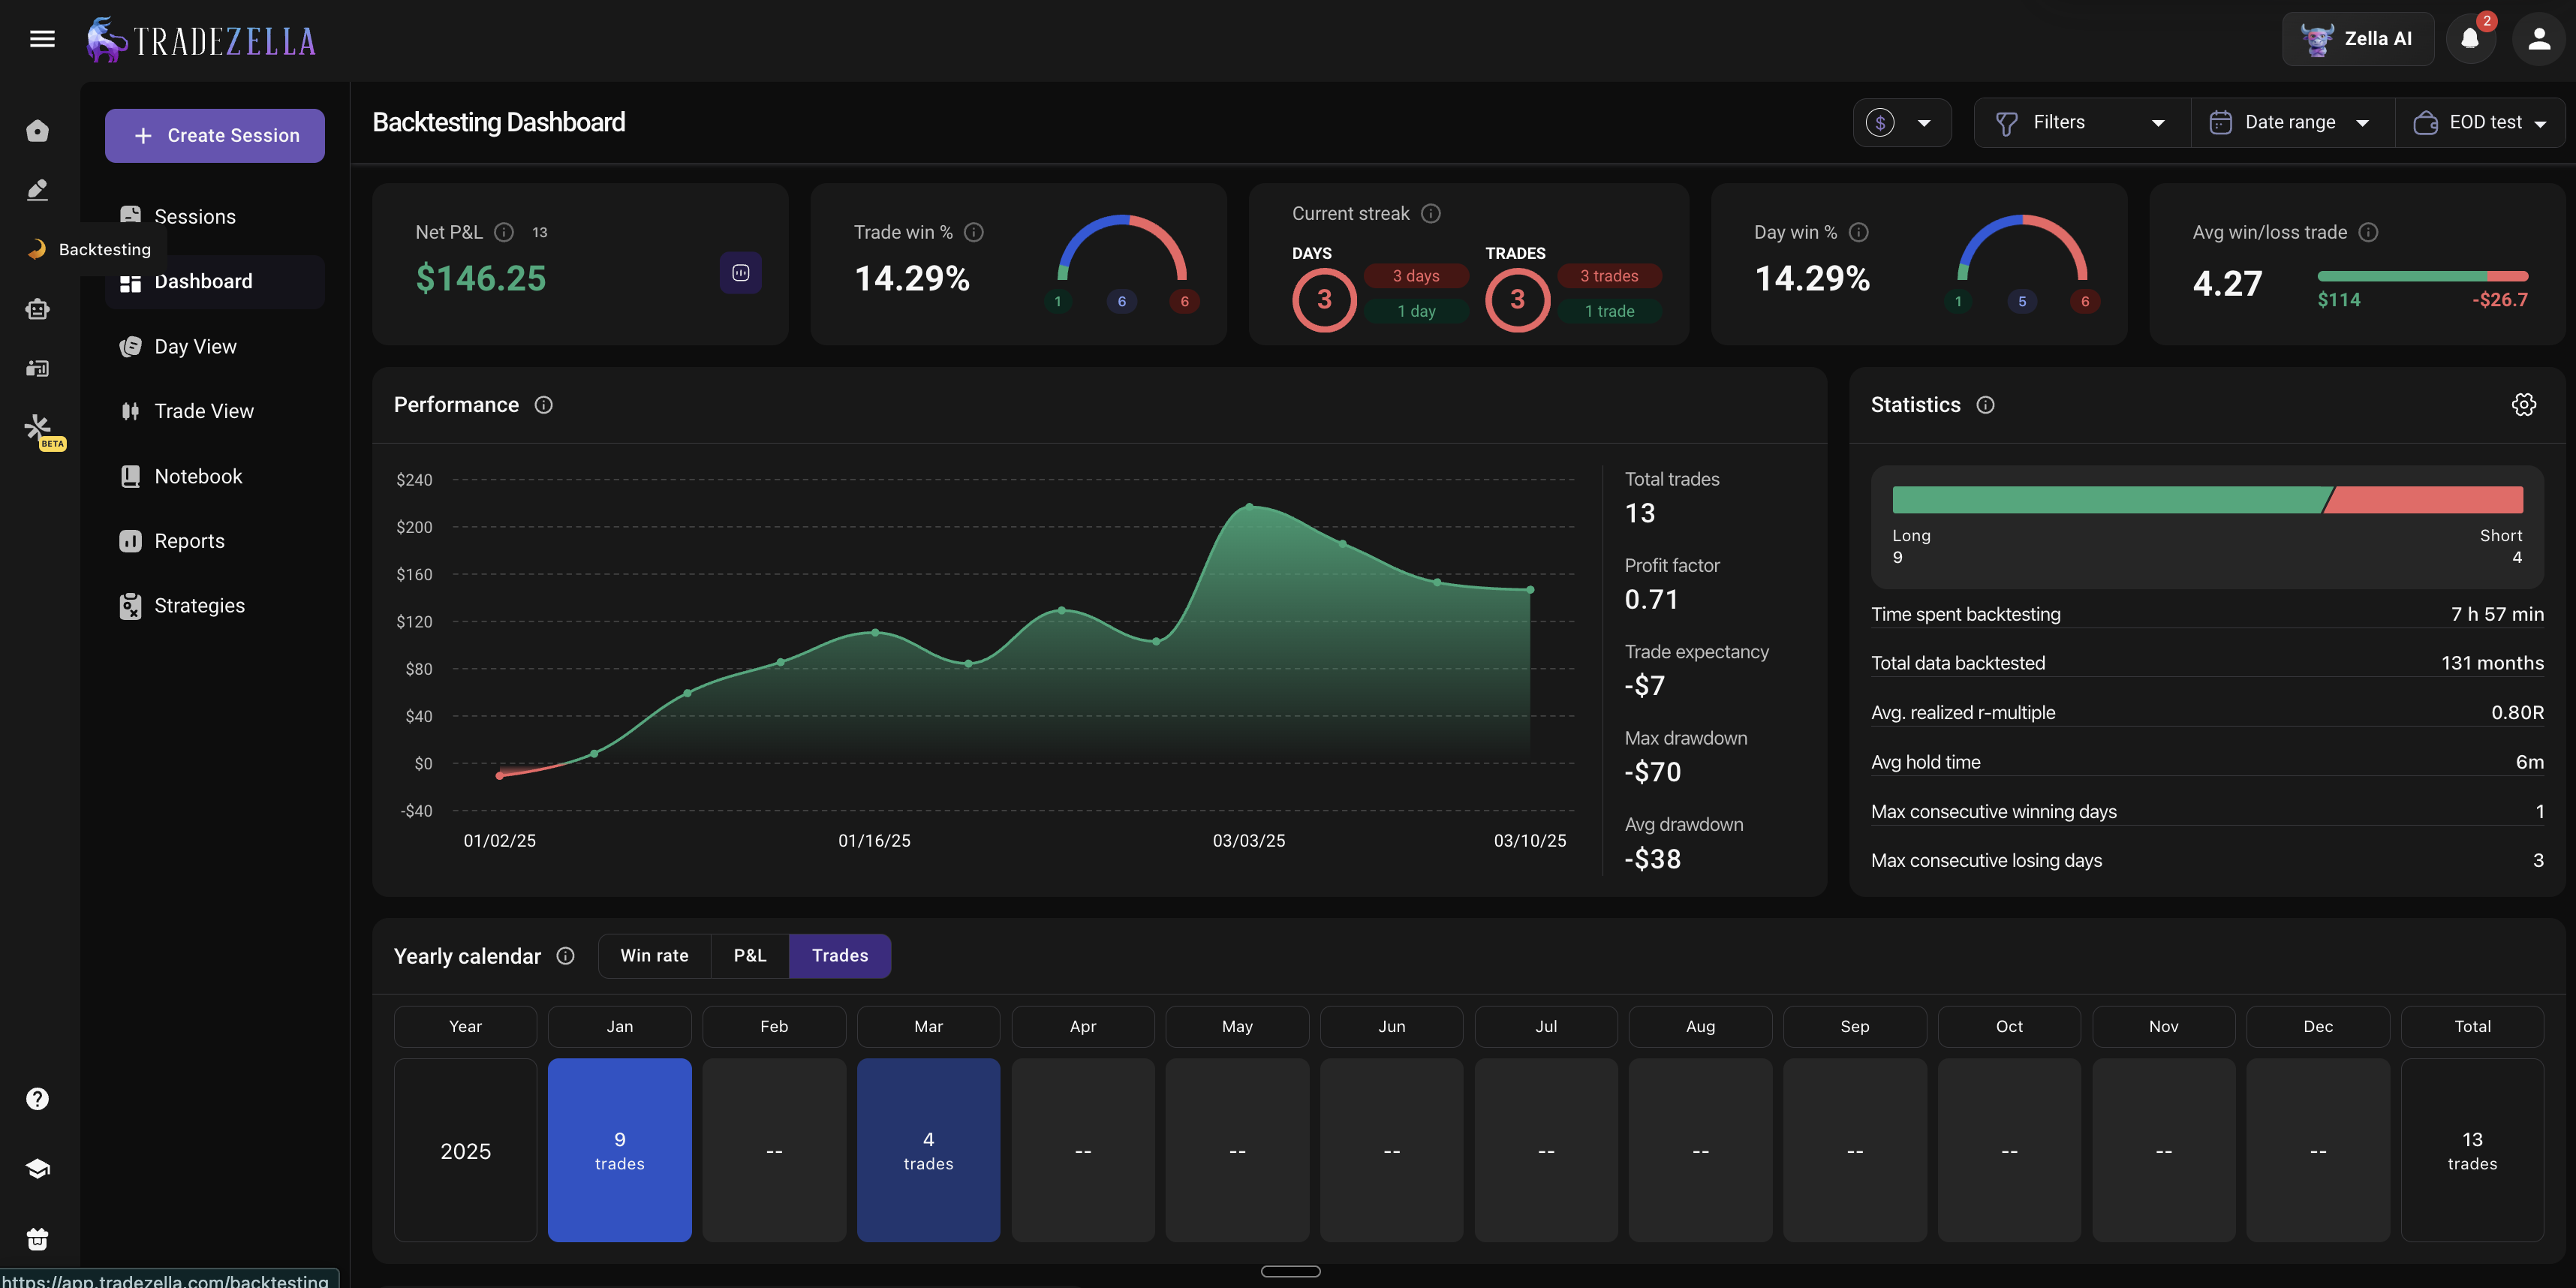
TradeZella has a full trading journal with 50+ analytics reports, custom Strategies, tag system, Notebook for pre-trade and post-session notes, Calendar view, Day and Time report, R-Multiple View, and trade replay. Every backtested trade automatically saves to your journal. More importantly, your backtest data sits alongside your live trading data imported from 500+ brokers.
You can directly compare: does your live win rate match your backtest? Is your actual expectancy within 15 to 20% of your simulated expectancy? If not, you know something is breaking down in execution. This backtest-to-live comparison is the most valuable thing any backtesting platform can offer, and TradingView cannot do it at all. For more on structuring this workflow, see our guide on how to build a trade journal and the best trading journal software comparison. The trade review process explains how to turn journal data into actionable improvements.
TradeZella Bactesting Dashboard
Live Trade Import
TradingView does not import your live trades. It is a charting and analysis platform. You can connect a broker for live execution through TradingView, but there is no analytics layer that compares your live performance to your backtested strategy.
TradeZella imports trades from 500+ brokers. Some connections are API-based (auto-sync), others use CSV import. Either way, your live trades land in the same dashboard as your backtest trades. This is how you find your trading edge: backtest a strategy, forward test it at reduced size, import the live results, and compare. If backtest shows 1.5 profit factor and live shows 0.9, the gap is execution, not strategy. That diagnostic is impossible on TradingView alone.
Does Either Platform Offer AI Analysis?
TradingView: No AI
TradingView does not have AI analysis for backtesting results. You get the metrics, the trade list, and the equity curve. Interpretation is entirely on you. TradingView does offer AI-powered features in other areas (chart pattern recognition, some technical analysis tools), but none of them connect to the Strategy Tester or analyze your backtest output.
TradeZella: Zella AI
Zella AI is TradeZella's built-in AI trading partner. After an automated backtest completes, Zella AI analyzes the results and identifies patterns that raw numbers might hide. If your backtest shows a 52% win rate overall but 68% during the London session, Zella AI flags that finding. You can then re-run the test with a session filter to validate it.
Beyond backtesting, Zella AI includes autonomous agents that work on your live trading data. The Auto Trade Tagger applies tags to every trade based on rules you define. Session Review compares your morning plan to your actual results after each trading day. Market Sentiment Briefing generates a personalized pre-market plan based on how you trade, your selected assets, and what you look at. More agents are coming. These agents work on completed trade data after your session, not during live trading. For a deeper look at how AI transforms post-trade analysis, see AI trade analysis and AI trading journal.
What About Charting?
Let's be honest. TradingView is the best charting platform available. Period. Over 100 million users, hundreds of built-in indicators, multi-chart layouts, drawing tools, real-time data across every asset class, and a social community with millions of published ideas. No other platform, including TradeZella, matches TradingView for pure charting.
TradeZella is not a charting platform. It does not compete with TradingView for real-time charting, market scanning, or live technical analysis. TradeZella uses TradingView-powered charts within its backtesting and replay features, which means you get familiar chart visuals during testing. But for your daily charting workflow (drawing levels, monitoring watchlists, scanning for setups), TradingView is the tool.
This is exactly why the "use both" recommendation exists. TradingView for charting and market analysis. TradeZella for backtesting, journaling, analytics, and prop firm tracking. They fill different roles in the same workflow.
How Does Pricing Compare?
TradingView Pricing
Basic (Free): Limited indicators, limited alerts, no Bar Replay, basic Pine Script backtesting.
Plus ($14.95/mo): 5 indicators per chart, Bar Replay, enhanced backtesting.
Expert ($59.95/mo): 25 indicators, priority support, all features.
Pine Script backtesting works on the free plan with limitations (fewer bars of historical data, slower processing). For serious backtesting, you need Plus or Premium to access Bar Replay and extended data.
TradeZella Pricing
TradeZella Pricing
Essential ($35/mo): Journal, analytics, Zella AI, broker import, Prop Firm Sync, backtesting and more.
Pro ($59/mo): Everything in Essential plus Zella AI agents, unlimited Strategies, unlimited accounts, 10 automated backtests per month.
Ultra ($99/mo): Everything in Pro plus 100 automated backtests per month, unlimited Mentor Mode, unlimited Spaces.
You can save 25% by paying annually. For a detailed pricing breakdown, check our pricing page.
Which Should You Choose?
The honest answer: most traders should use both. Here is how to decide.
Use TradingView for Backtesting If:
You already know Pine Script or are comfortable learning a programming language.
You want access to thousands of community-published strategies and indicators.
You need a quick backtest on the same platform where you chart, without switching tools.
You are a quantitative trader who needs fine-grained control over every parameter.
Use TradeZella for Backtesting If:
You do not code and do not want to learn Pine Script.
You want backtest results connected to your live trading journal with 50+ analytics reports.
You need to compare backtest performance to live performance in the same dashboard.
You want AI analysis from Zella AI to identify patterns in your backtest results.
You want pre-built templates so you can start testing immediately without writing rules or code.
Use Both If:
You want the best charting platform (TradingView) paired with the best backtesting-to-live workflow (TradeZella). Chart your setups on TradingView. Validate your strategy on TradeZella. Import your live trades into TradeZella. Compare backtest vs live in one place. This is what professional traders who take their process seriously actually do.
TradeZella is the better backtesting platform for beginners. Writing "buy when 20 EMA crosses above 50 EMA" is something any trader can do on day one. Writing if ta.crossover(ta.ema(close, 20), ta.ema(close, 50)) requires learning a programming language first. If you are within your first year of trading, every hour spent learning Pine Script syntax is an hour not spent studying price action, building Strategies, or reviewing your trades.
TradingView is the better platform for beginners who want to learn technical analysis through charting. The community, the educational content, and the chart tools are world-class. But for backtesting specifically, the coding requirement creates a barrier that plain English eliminates. For a step-by-step backtesting walkthrough designed for newer traders, see how to backtest a trading strategy and our guide to backtesting without code.
Key Takeaways
TradingView backtesting requires Pine Script coding. TradeZella uses plain English rules. The learning curve gap is weeks versus minutes.
TradingView has no trading journal. TradeZella has 50+ analytics reports, custom Strategies, tags, Notebook, and Calendar. Backtest results feed directly into the same journal as live trades.
TradingView does not import live trades. TradeZella imports from 500+ brokers, enabling direct backtest-to-live performance comparison.
TradingView has no AI. TradeZella has Zella AI with autonomous agents (Auto-Tagger, Session Review, Market Sentiment Briefing, more coming) that analyze backtest and live data.
TradingView is the best charting platform. TradeZella is not a charting replacement. Most serious traders use both.
For prop firm traders, TradeZella wins outright. Prop Firm Sync, Challenge widget, multi-account tracking. TradingView has none of this.
Frequently Asked Questions
Is TradingView backtesting better than TradeZella?
It depends on what you need. TradingView is better if you know Pine Script and want quick backtests on the same platform where you chart. The community library of published scripts is a major advantage for finding pre-built strategies. TradeZella is better if you do not code, want plain English rules, need journal integration with 50+ analytics reports, or want AI analysis from Zella AI. TradeZella is also better for traders who need to compare backtest performance to live trading results in one dashboard. Most traders get the best results by using both platforms together.
Do I need to learn Pine Script to backtest on TradingView?
Yes. TradingView's Strategy Tester requires Pine Script to define entry rules, exit rules, position sizing, and filters. You can copy community-published scripts and run them without writing code, but modifying those scripts or building your own strategy requires understanding the language. The learning curve ranges from a few days for traders with programming experience to several weeks for complete beginners. If you want to backtest without coding, TradeZella's plain English rules or journal-based validation (see our guide to backtesting without code) are alternatives that require zero programming knowledge.
Can I use TradingView and TradeZella together?
Yes, and this is the recommended setup for most traders. Use TradingView for charting, drawing levels, monitoring watchlists, and scanning for setups. Use TradeZella for backtesting (plain English rules or bar replay), journaling every trade (imported from 500+ brokers), analytics (50+ reports), AI analysis (Zella AI), and prop firm tracking (Prop Firm Sync). The two platforms complement each other because they solve different problems. TradingView shows you the market. TradeZella shows you your performance.
Which platform is better for beginners?
For backtesting, TradeZella is better for beginners because it eliminates the coding requirement. Writing "buy when 20 EMA crosses above 50 EMA" takes seconds. Writing the equivalent Pine Script takes learning a programming language. For charting and learning technical analysis, TradingView is better for beginners because of its massive community, educational content, and free tier. If you are new to trading, start with TradingView for charting and TradeZella for backtesting and journaling.
Can TradeZella replace TradingView?
No. TradeZella is not a charting platform and does not try to be one. It cannot replace TradingView for real-time charting, market scanning, multi-chart layouts, or live technical analysis. TradeZella uses TradingView-powered charts within its backtesting and replay features, but it is not a substitute for TradingView as a charting tool. What TradeZella does replace is the gap that TradingView leaves: journaling, analytics, backtest-to-live comparison, AI analysis, and prop firm support.
Does TradingView have a trading journal?
No. TradingView has no trading journal. There is no way to log trades, add notes, tag setups, compare performance across strategies, or review your trading history. TradingView shows your Strategy Tester results for backtesting and can display a trade history if you connect a broker for live execution, but there are no analytics, no tagging, no Strategies, no Calendar view, and no review workflow. If you use TradingView, you need a separate journal. TradeZella is the most complete option because it connects your backtest data, replay data, and live trading data in one analytics dashboard.